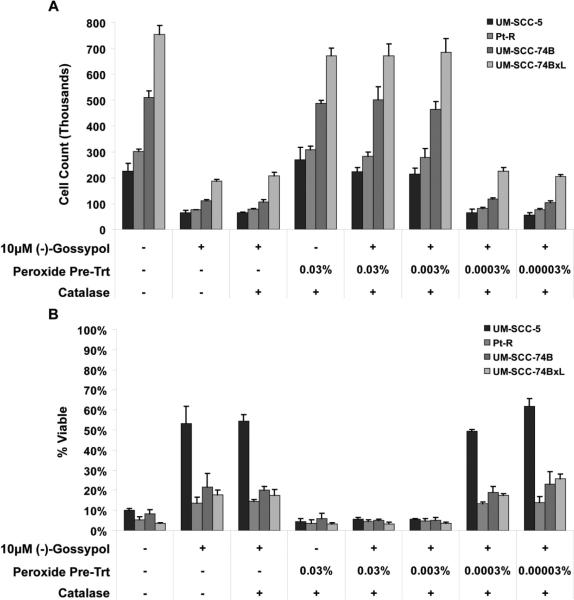
Figure 5.
Cell viability following 48 hrs treatment with peroxide-inactivated (−)-gossypol. A. Whole cell counts following treatment. B. Percentage of viable (trypan-blue negative) cells following treatment. In both parts (A) and (B), lanes 1, 4, 5, and 6 represent the effect of absent or inactivated (−)-gossypol, while lanes 2, 3, 7, and 8 represent the effect of active (−)-gossypol.

