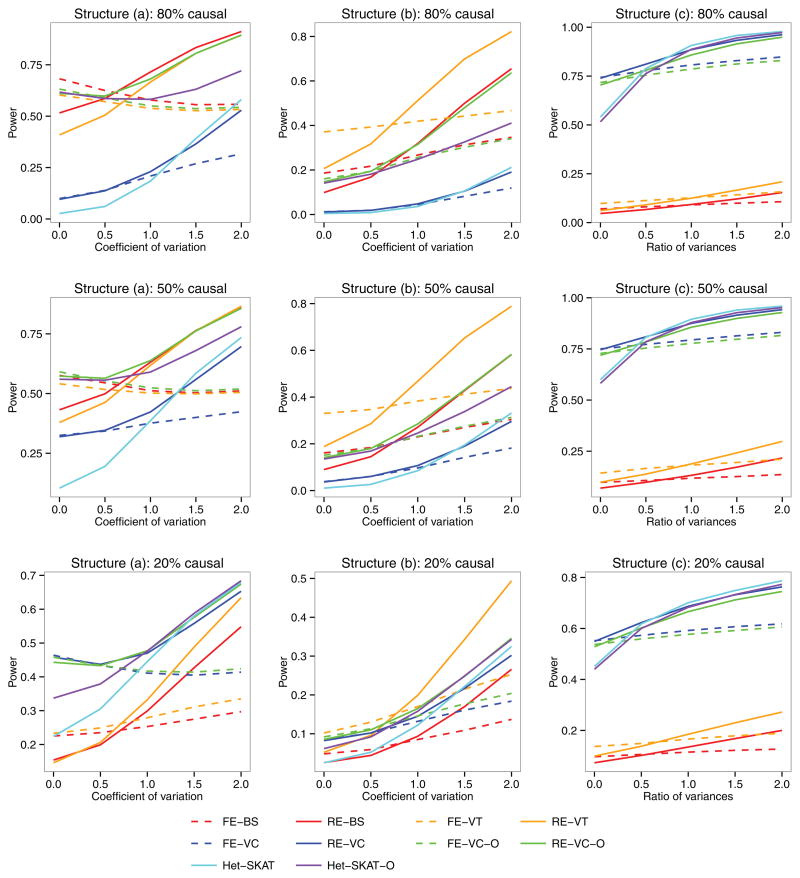
Figure 1.
Power as a function of the between-study heterogeneity for the quantitative trait. The left, middle, and right panels correspond to three different genetic structures: (a) genetic effects exhibit at the burden score level for variants with MAFs< 5%, (b) genetic effects exhibit at the burden score level for variants with MAFs< 1%, and (c) genetic effects exhibit at the individual variant level. For each structure, 80%, 50% or 20% of the variants in ten 300 base-pair regions were randomly selected to be potentially causal.

