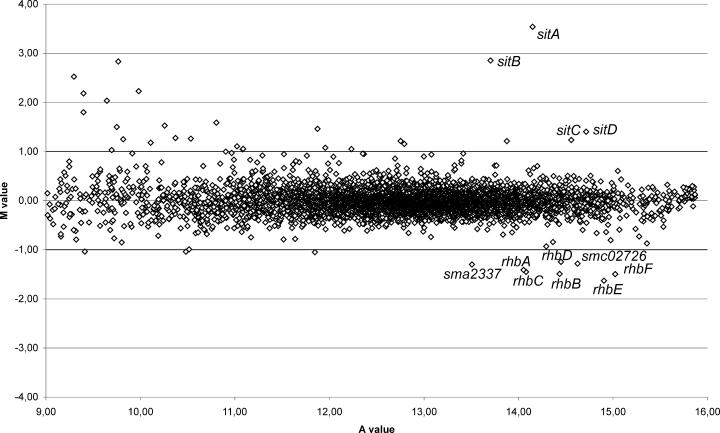
FIG. 6.
Scatter plot for the microarray-based analysis of S. meliloti genes affected by deletion of the fur gene. The scatter plot shows the logarithmic mean signal ratios (M values) versus. the logarithmic mean signal intensities (A values) obtained for comparison of the S. meliloti wild-type strain Rm1021 to the fur mutant Rm1021Δfur by microarray hybridization. Indicated are the differentially expressed genes that are involved in metal acquisition. Genes were only regarded as differentially expressed when the M values were ≥1.0 or ≤−1.0, the A values were ≥9.0, and the P values ≤0.05.

