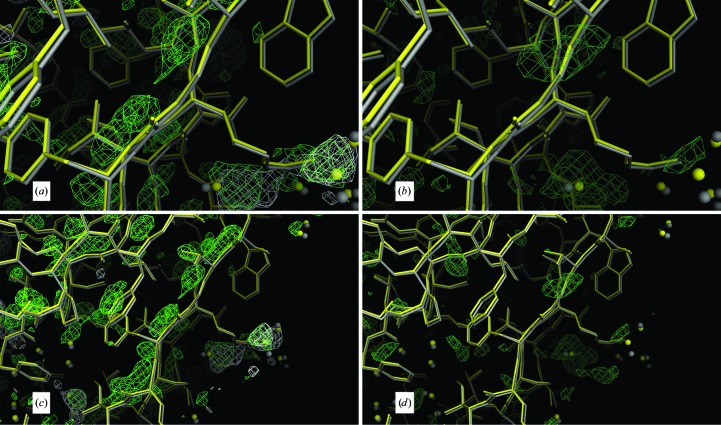
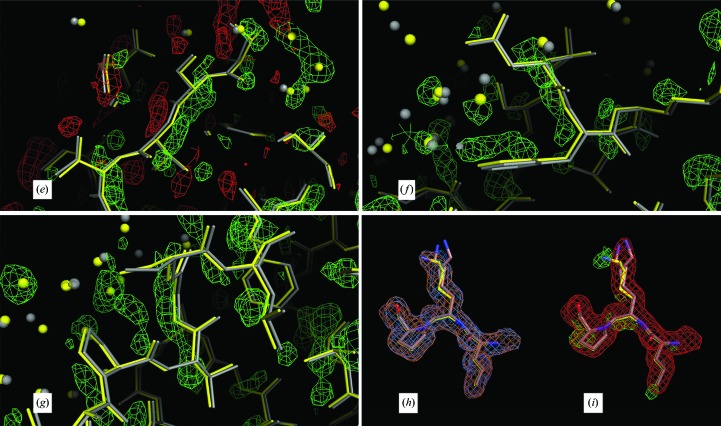
Figure 10.
Further evidence in support of a restrained model. In (a)–(i), the low-temperature constrained (gray) and restrained (yellow) models are displayed. All maps are σA-weighted Fourier maps, with the 2F o − F c maps contoured at 1.0σ and the F o − F c maps contoured at 2.5σ. (a)–(g) show chain M and (h) and (i) show chain I. (a)–(d) show the segment V122-G-T124 in the foreground. In (a) and (c), the maps that are superposed on the models are the non-averaged F o − F c density (light green) and the averaged F o − F c density (in white) phased by the constrained model. In (b) and (d), the model is superposed on the non-averaged F o − F c density phased by the restrained model. In (e), the segment T71-S-V-T74 is superposed on the non-averaged F o − F c density phased by the constrained model, with negative density displayed in red and positive density in light green. In (f), the segment N64-F65 is shown superposed on the positive density of the non-averaged F o − F c map phased by the constrained model. In (g), the segment V57-G-S59 is superposed on the positive density of the F o − F c map phased by the constrained model. Chain M has the largest r.m.s. deviation of 0.208 Å between the restrained and constrained models. In (a), (c), (e), (f) and (g) the non-averaged difference map (light green) suggests that a deviation from strict icosahedral noncrystallographic symmetry exists because it always lies on the opposite side of the restrained model (yellow) from the constrained model (gray), suggesting that the constrained model should move toward the restrained model to accommodate the difference density. In (a) and (c) the density of the averaged difference map (white) has been averaged out around the chains, leaving only random difference peaks away from the chain. In (b) and (d) the restrained refinement has produced a cleaner difference map without the density around the chain as the chain moved towards the density seen in (a) and (c). In (h), the fragment L96-K97-P98 is shown superposed on the non-averaged constrained 2F o − F c (orange) and the non-averaged restrained 2F o − F c (blue) electron-density maps. Since these two maps match well, the density color appears almost white. In (i), the non-averaged constrained F o − F c map (green) and the averaged constrained 2F o − F c map (red) are shown. Clearly, from the difference density and the non-averaged 2F o − F c density, Lys97 on chain I does not have the same conformation as the refined constrained model, which was modeled with alternate conformations, neither of which coincide with the conformation found in chain I.


