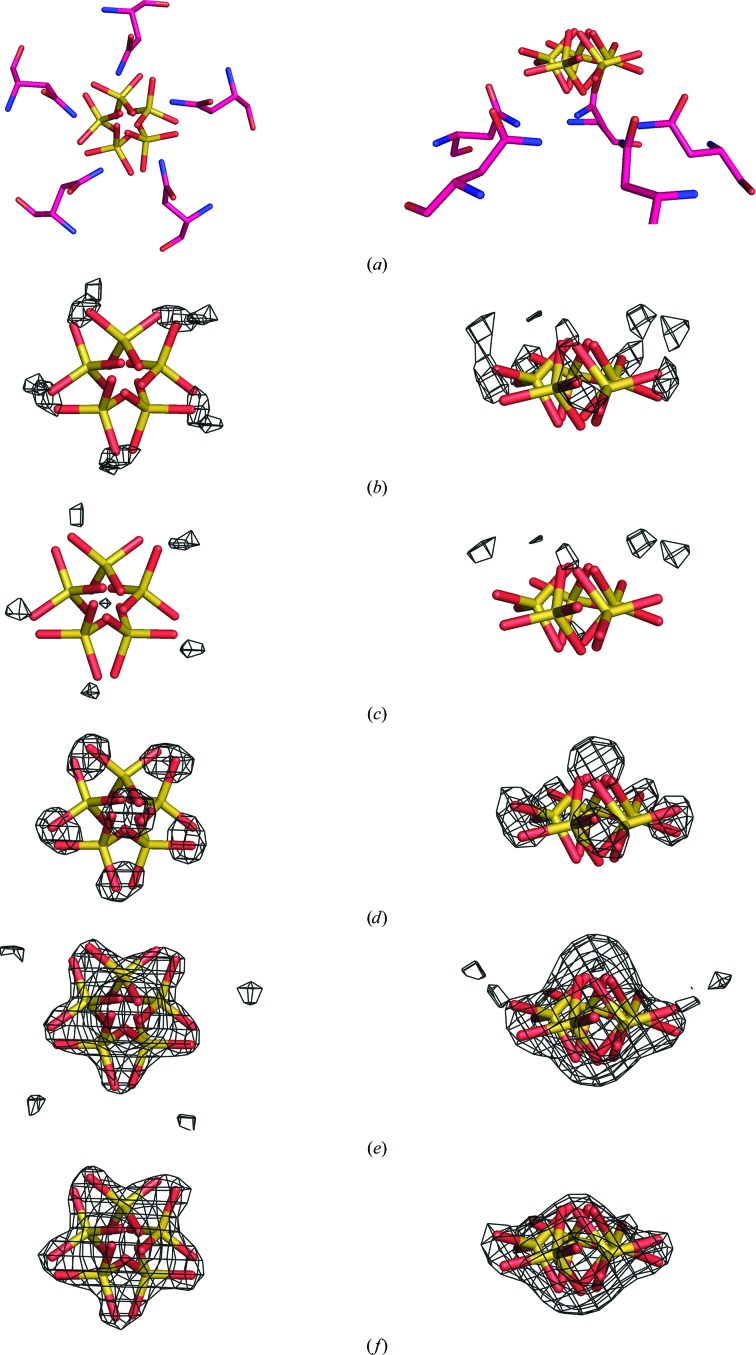
Figure 3.
Modeling of the sulfate ion on the fivefold axis. In all panels the sulfate ion on the fivefold axis from the final constrained model is shown. In (a), the surrounding Asn117 residues are also shown to illustrate the hydrogen bonding between the amide N atoms and the equatorial O atoms of the sulfate ion. On the left the view is down the fivefold axis and on the right it is perpendicular to the axis. In (b)–(f), σA-weighted F o − F c maps (contoured at 2.5σ) are superposed on the model, each phased by the constrained model in which the sulfate ion position was treated differently and then icosahedrally averaged. In (b), the map was phased by a model in which the S atom of the sulfate ion was fixed on the fivefold axis. In (c), the map was phased by a model in which the sulfate ion was not fixed on the fivefold axis. It is seen that the density around the equatorial O atoms decreases from (b) to (c). In (d), the map was phased by a model in which the sulfate ion was replaced by a chloride ion. The increased density around the equatorial O atoms reflects their absence in the model. In (e), the map was phased by a model in which the sulfate ion was replaced by a water molecule. In (f), the map was phased by a model in which nothing occupied the sulfate ion position. The density in both (e) and (f) suggests a sulfate ion with the S atom off the fivefold axis and the equatorial O atoms strategically located between the asparagine side chains to minimize steric clashes.

