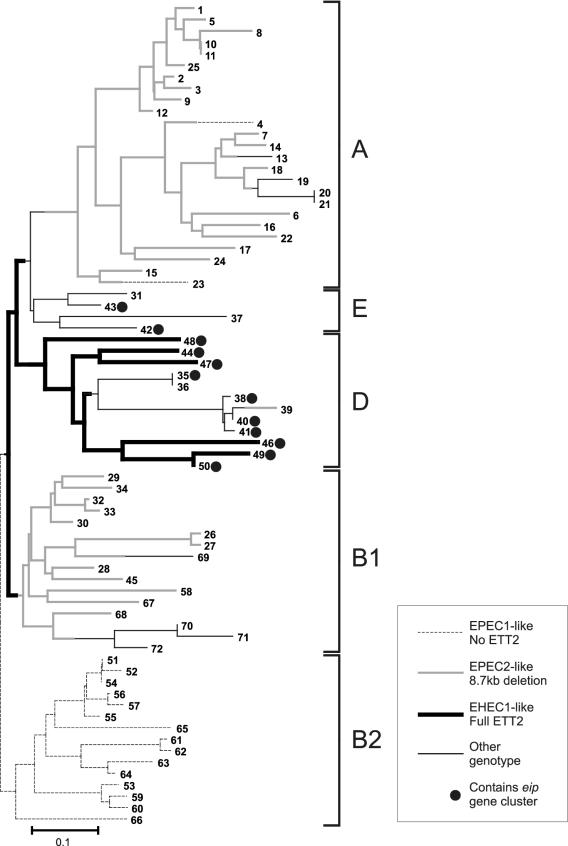
FIG. 5.
TP-PCR results superimposed on phylogenetic structure of E. coli. The tree was obtained by neighbor-joining analysis of the ECOR MLEE data (available at http://foodsafe.msu.edu/whittam/ecor) using the program Neighbor, part of the PHYLIP package (J. Felsenstein; available from http://evolution.genetics.washington.edu/phylip.html). Branches containing one of the three most common genotypes are indicated by bold, dashed, or gray lines. Filled circles indicate strains with eip clusters.

