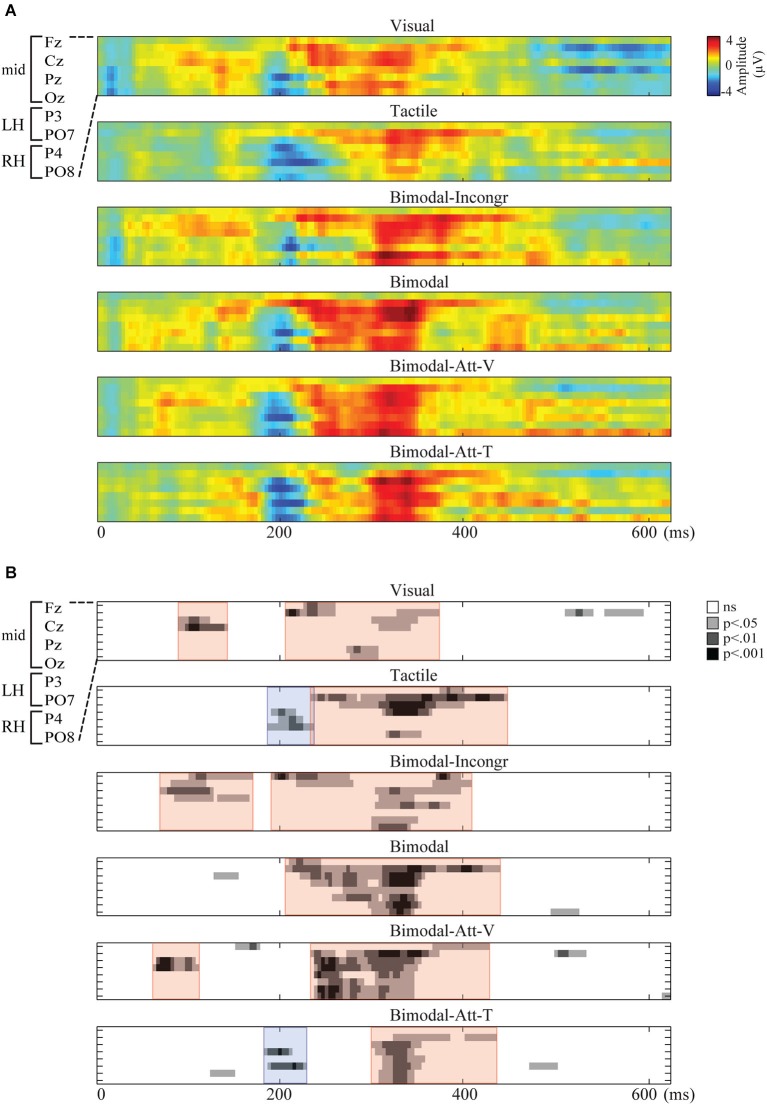
Figure 1.
Spatiotemporal representations of the endogenous ERP for each condition, with time (ms) on the x-axis and electrodes on the y-axis. Electrodes from top to bottom: Fz, Cz, Pz, Oz, P3, P4, PO7, PO8. (A) The Grand Average of the amplitudes of the endogenous ERP (μV) for each condition. (B) The statistical significance of the endogenous ERP (p-values) resulting in stable segments, clustered in ERP components. ERP components are marked by colored overlays in red and blue for positive and negative components, respectively.

