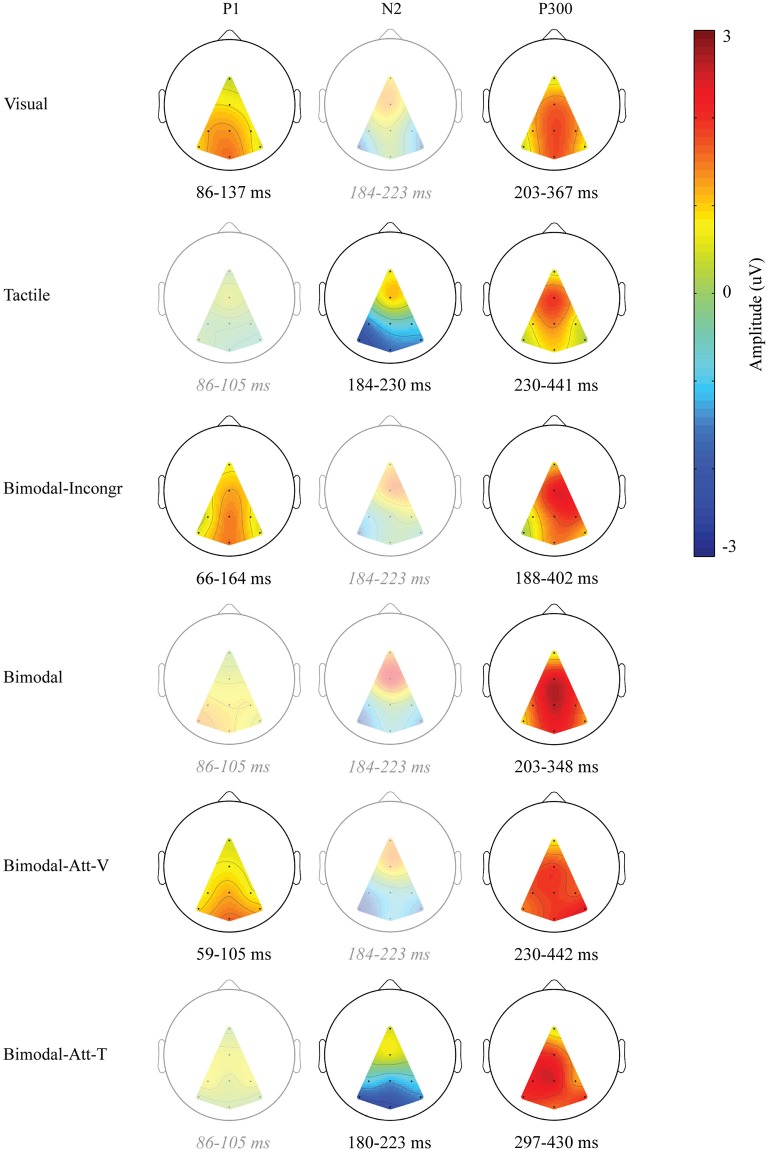
Figure 2.
Scalp distributions of the endogenous ERP for the identified endogenous ERP components. Only that part of the scalp is visualized, in which electrode information could be interpolated. Amplitudes (μV) are averages calculated within each ERP component’s interval, averaged over participants. If no ERP component was identified, the overlapping interval (of the windows of the ERP component for conditions in which it was identified) was used to visualize that activity for comparison. In that case, the scalp plot is left semitransparent, and the corresponding interval is shown in gray and italics.

