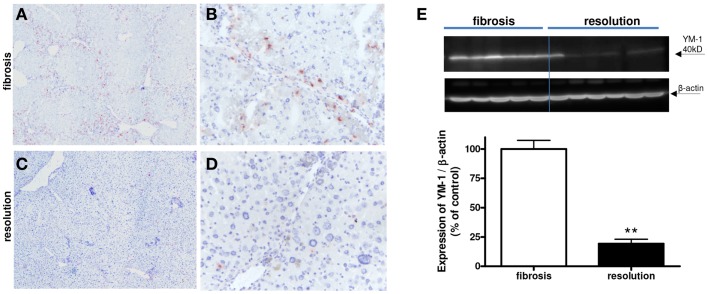
Figure 11.
Expressions of YM-1 (M2) in fibrotic mouse livers [4 weeks CCl4 (A,B)] and in fibrotic livers undergoing resolution [after cessation of CCl4 administration (C,D)]. Immunohistochemical pictures demonstrate an overview [(A,C) magnification 40×] and close up [(B,D) magnification 200×]. (E) Western blot quantification of YM-1 expression in fibrosis versus resolution. **p < 0.01. N = 6/group.

