Figure 5.
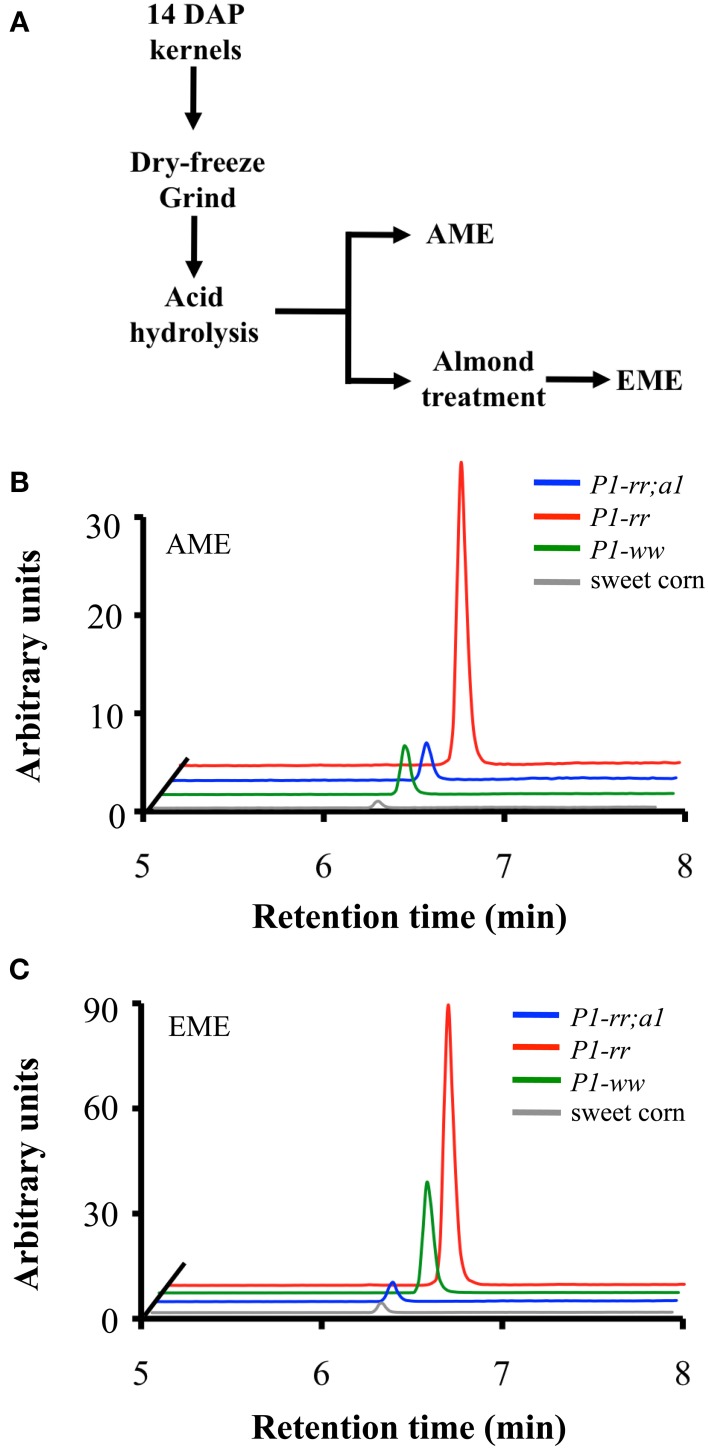
Apigenin content in whole-food maize formulations. (A) Work flow of whole-maize kernel food extract preparation, AME: acid whole maize extract and EME: enzymatically treated whole maize extract. Chromatograms corresponding to apigenin content from P1-rr (red); P1-rr;a1 (blue); P1-ww (green) and sweet corn (gray) in AMEs (B) and EMEs (C). Arbitrary units correspond to peak intensity for the 268.9/117.0 transitions in counts per second.

