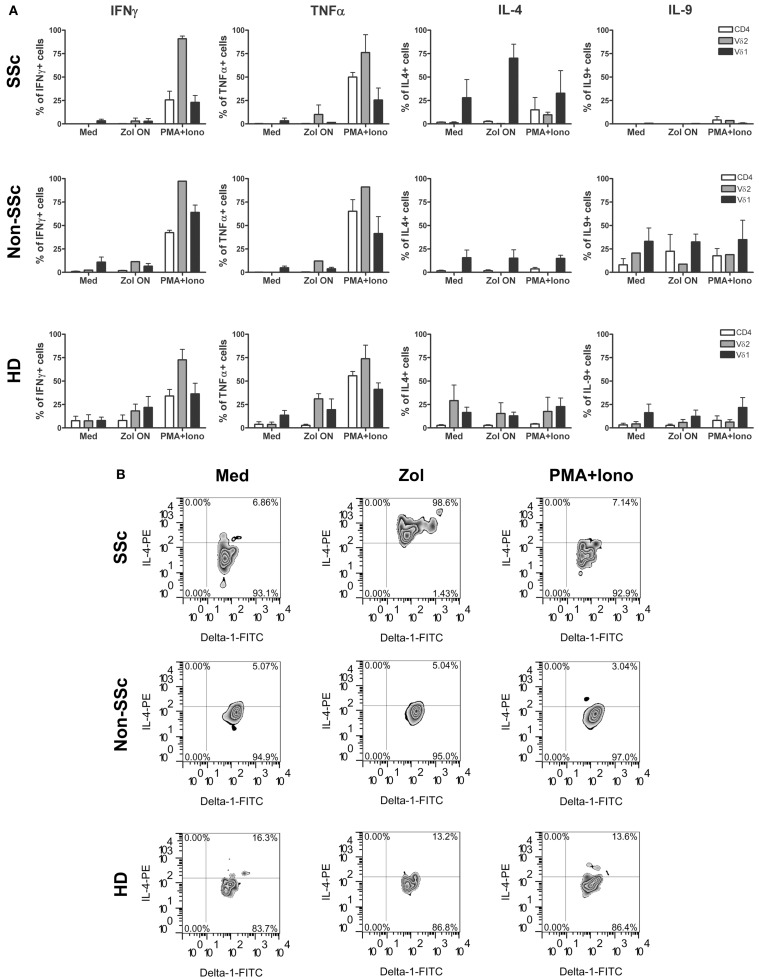
Figure 1.
Cytokine expression pattern in T cell subsets in systemic sclerosis (scleroderma, SSc), control patients, and healthy donors is shown. Bars represent percent cells in the indicated T cell subsets ±1 SEM after activation of PBMC from healthy donors (HD) (n = 5) or scleroderma (SSc) patients (n = 3) or non-scleroderma (SSc) control patients (n = 3) following stimulation with Zol, PMA, and ionomycin or medium (Med) (A). (B) Representative plots show IL-4 secretion by Vδ1+ T cells from RP-2, a control patient, or a HD in response to Zol, PMA + Ionomycin, or medium.

