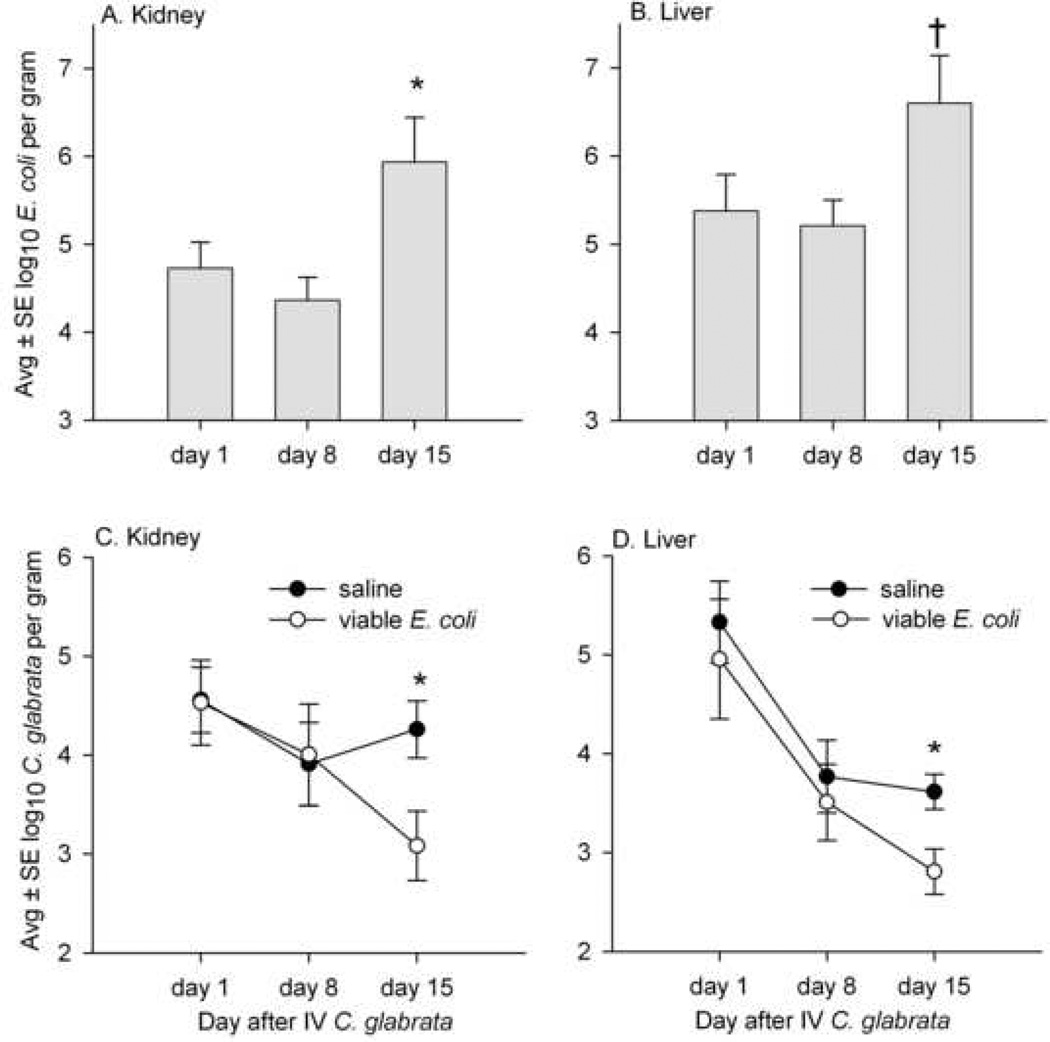
FIG. 3.
Concentrations of viable E. coli and C. glabrata in the kidneys and livers of mice sacrificed on days 1, 8, and 15 after IV injection of 108 C. glabrata, and with saline or 108 viable E. coli injected IP 16 hr before each sacrifice. A and B show that the numbers of E. coli recovered from the kidney and liver on day 15 were increased compared to days 1 and 8 (* and †, increased compared to days 1 and 8 at P<.05 and P<.01, respectively). C and D show that, on day 15, the numbers of C. glabrata in the kidney and liver were decreased in mice treated with E. coli compared to mice treated with saline, and these differences were significant (*P<.05). Each time point represents 9 to 10 mice given IP saline and 7 to 10 mice given IP E. coli.

