Figure.

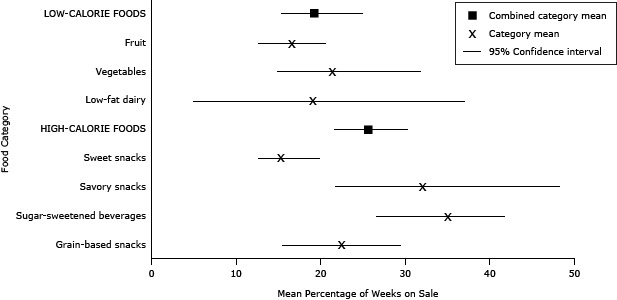
Mean percentage of weeks foods were on sale, by food category and aggregate food category, in an urban supermarket, Philadelphia, Pennsylvania, April through August 2010 and December 2010 through October 2012.
| Food Category | Mean Percentage of Weeks on Sale (95% Confidence Interval) |
|---|---|
| Low-calorie foods | 19.2 (15.4–25.1) |
| Fruit | 16.5 (12.7–20.7) |
| Vegetables | 21.4 (14.9–31.9) |
| Low-fat dairy | 19.0 (5.0–37.1) |
| High-calorie foods | 25.7 (21.6–30.4) |
| Sweet snacks | 15.3 (12.6–20.0) |
| Savory snacks | 32.0 (21.8–48.3) |
| Sugar-sweetened beverages | 35.0 (26.6–41.9) |
| Grain-based snacks | 22.5 (15.5–29.6) |
