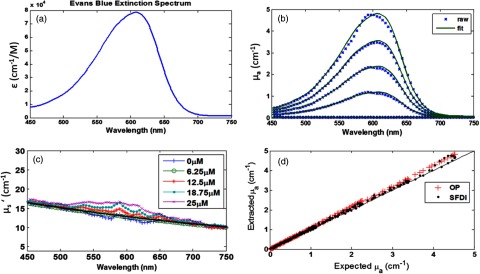
Fig. 3.

Cross-validation results from tissue phantom experiments. (a) shows the extinction spectrum recovered of Evans Blue (EB) dye (450 to 750 nm). (b) shows hyperspectral SFDI absorption spectra from absorption titration study and fitting of the overdetermined dataset for EB concentration measurement. EB concentrations were 25, 18.75, 12.5, 6.5, and from top to bottom. (c) shows reduced scattering spectra obtained over the absorption titration study. (d) shows a scatter plot of SFDI and OP measured absorption over expected values for all wavelengths.
