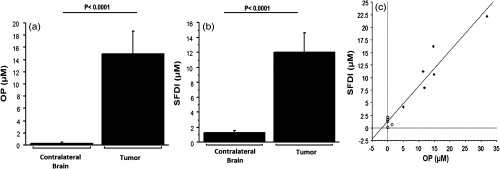
Fig. 5.

Uptake of mitoxantrone as determined by OP (a) and SFDI (b) in six treated, tumor-bearing Sprague Dawley rat postmortem brain specimens 4 h after drug injection. Together, SFDI measurements were linearly related to concentrations measured by OP (c, , ). A better correlation was seen with higher values in the tumor groups (solid circles, tumor) than with low concentrations in healthy tissue in the opposite cerebral hemisphere (open circles, contralateral brain).
