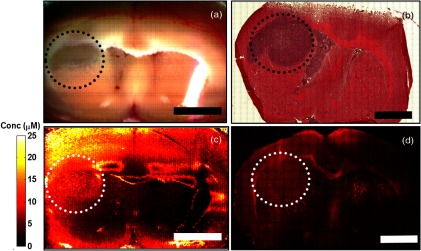
Fig. 6.

Mitoxantrone distribution map. (a) shows the composed RGB image generated from 640, 550, and 450 nm reflectance images. (b) shows tumor tissue verification with hematoxylin and eosin staining. (c) shows the spatial mitoxantrone deposition measured by hyperspectral spatial frequency domain imaging. (d) depicts a stitched, composite image of mitoxantrone fluorescence measured by confocal microscopy. Dotted circle delineates tumor area. Bar is 3 mm.
