
FIGURE 8.
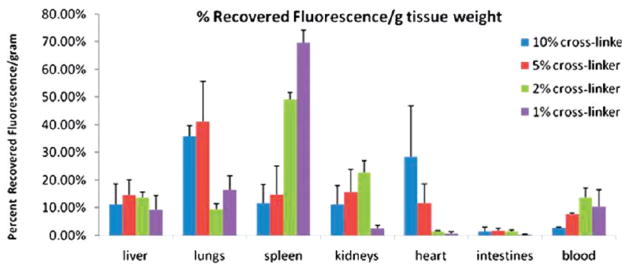
Biodistribution of RBCMs 2 h post dosing by percent recovered fluorescence normalized for tissue weight. Error bars represent one standard deviation, with n = 3 for each case. Reprinted with permission from ref 54. Copyright 2011 National Academy of Science.