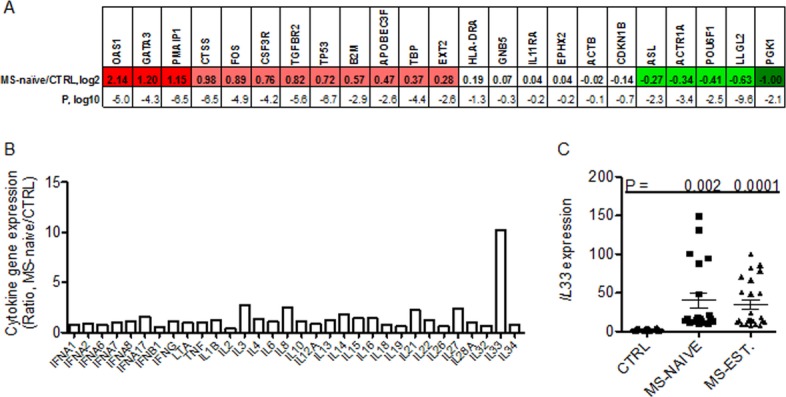
Figure 1.

Gene-expression profiles in MS-naive subjects. (A) Expression levels of 23 target genes were determined by quantitative reverse-transcription PCR and normalized to expression of GAPDH. Results are expressed as the ratio of the expression level of the indicated genes in the MS-naive cohort relative to the control (CTRL) cohort, log2. Genes are identified that showed statistically significant (P < 0.05 after Bonferroni's correction for multiple testing) increased (red boxes) or decreased (green boxes) expression: CTRL, N = 100; MS-naive, N = 40. Statistical significance of the expression level of each target gene between each disease cohort and CTRL was determined using Student's t-test. P values are expressed as log10. (B) Expression levels of indicated cytokine genes were determined as in described in (A) in MS-naïve and CTRL cohorts. Results are expressed as the MS-naïve/CTRL ratio after normalization to levels of GAPDH. (C) Expression levels of IL-33 were determined in additional subjects: CTRL (N = 20), MS-naïve (N = 30) and MS-EST (N = 40). Line with error bars is the mean and S.D. P values were determined using the unpaired t-test with Welch's correction. All the MS patient materials for these experiments were obtained from the Accelerated Cure Project. The control cohort (CTRL) consisted of healthy volunteers without autoimmune disease or a family history of autoimmune disease or other chronic diseases or acute or chronic infections. The MS naïve subjects were on no immunomodulatory drugs and all the established relapsing-remitting MS patients (MS-EST) were on Glatiramer acetate. Gender distributions for all groups were 75:25 F:M and age distributions were not statistically different (Ages; CTRL: 41 ± 11, MS-naïve: 35 ± 6, MS-established: 43 ± 10)
