
Figure 7. Model of signalling from Dachsous and Fat to the SWH pathway.
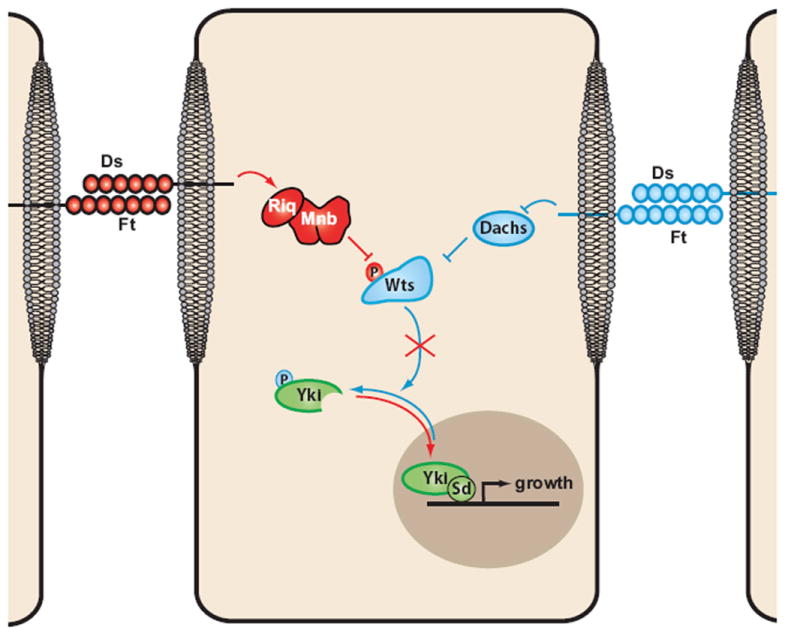
Signalling from the Ds ICD is represented in red (positively regulating growth) and signalling from the Ft ICD in blue (negatively regulating growth). (Ds: Dachsous, Ft: Fat, Riq: Riquiqui, Mnb: Minibrain, Wts: Warts, Yki: Yorkie, Sd: Scalloped)