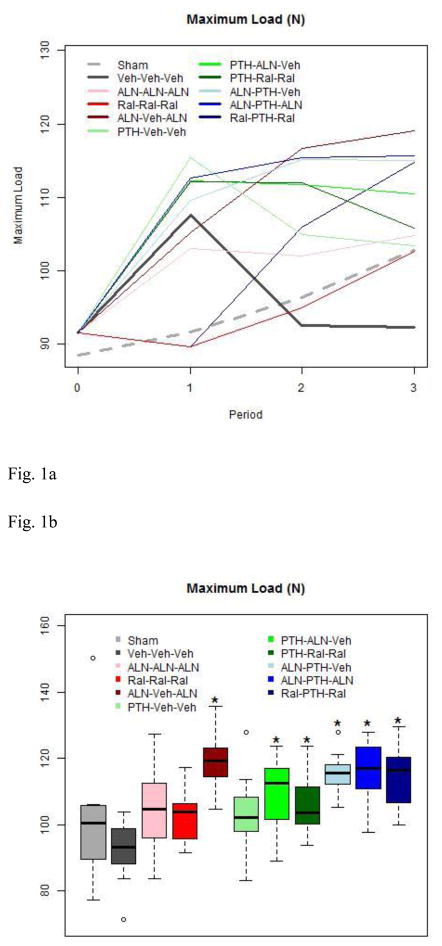
Figure 1.
1a. Maximum Load by Group throughout the Study
Treatment with Aln or PTH increased maximum load. Switching from PTH to vehicle results in the same maximum load by the end of study, as in OVX rats that receiv no treatment. Note that OVX and Sham referent groups are depicted by thickened solid or dashed lines, respectively.
1b. Maximum Load at End of Study
Boxes are defined by the 25th and 75th percentiles, with the median marked by a solid line inside the box. “Whiskers” of the boxplots extend to the last observation within 1.5X the length of the box (interquartile range) from the edges of the box. Any observed points beyond the whiskers are show as an open circle. Boxes marked with an asterisk are significantly different from the Veh-Veh-Veh group after a Tukey adjustment for multiple comparisons.
Except for the Aln “holiday” group, only groups that received both PTH and some combinaton of pre-PTH or post-PTH anti-resorptive treatment had greater maximum load at the end of study. Traditional monotherapies produced no significant changes.

