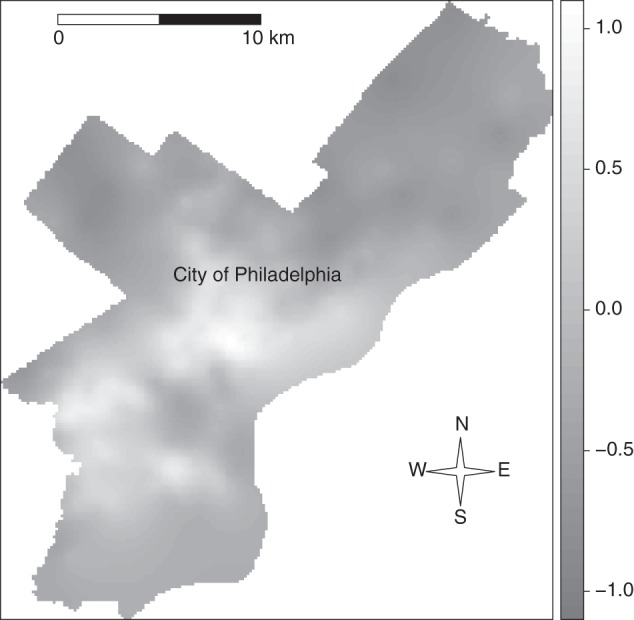
Figure 2.

Interpolated levels of physical disorder in Philadelphia, Pennsylvania, constructed using Google Street View imagery that was initially captured between 2007 and 2011. Lighter areas have more physical disorder; the large, central cluster of physical disorder corresponds roughly with North Philadelphia, and the smaller clusters south and west of it correspond with West Philadelphia and the Gray's Ferry and Point Breeze areas of South Philadelphia.
