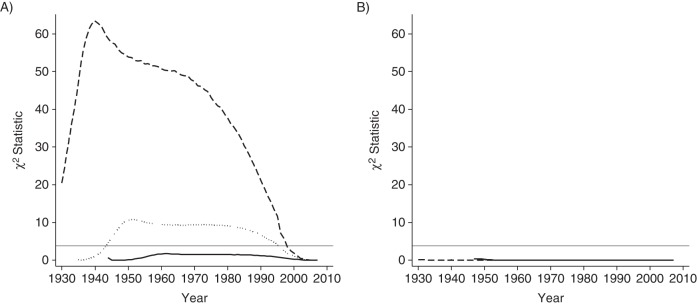
Figure 2.

χ2 test of differences between adjusted and unadjusted smoking prevalence rates for A) men and B) women at ages 60–69 years (solid line), 70–79 years (dotted line), and 80 or more years (dashed line) in 2007. The horizontal gray line marks the critical value at the 5% level of statistical significance.
