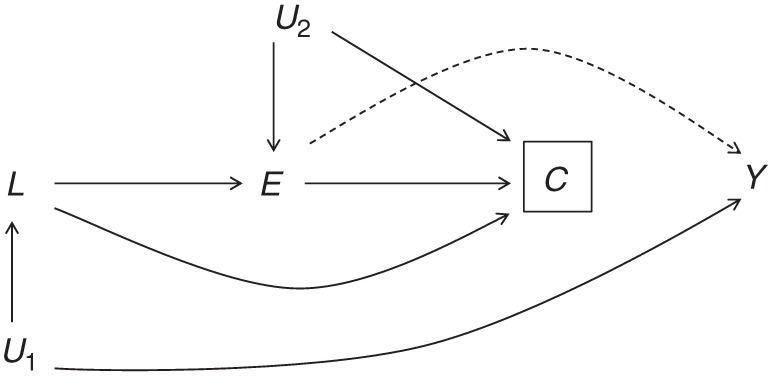
Figure 3.

Directed acyclic graph representation of potentially informative censoring in a study population of active US aluminum industry workers, 1998–2012. Censoring (C) is connected to the outcome Y through health status L. U1 represents unmeasured common causes of both L and Y. Exposure (E) is also connected with censoring, both directly and through unmeasured common causes (U2).
