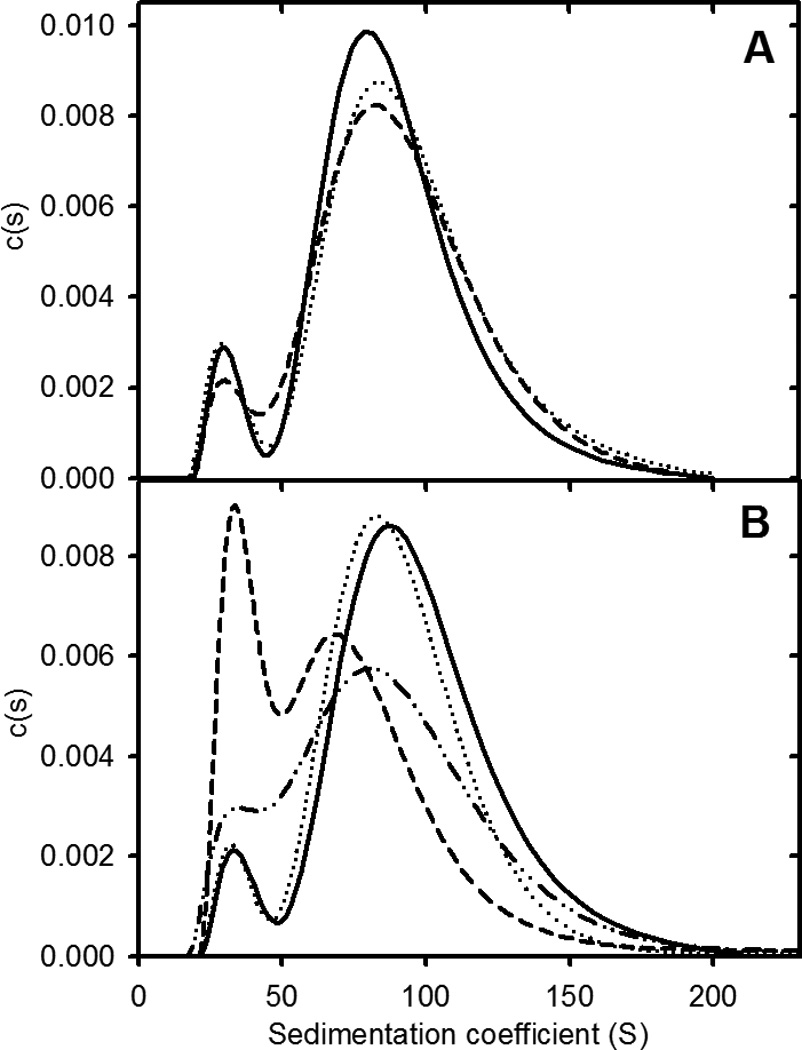
Figure 2.

ApoC-II fibril size distributions following exposure to shear. Panel A: Sedimentation coefficient distributions for preformed apoC-II fibrils (0.3 mg/ml; solid line) and for fibrils subjected to rapid vortexing for 20 min (dotted line) and bath sonication for 15 min (dashed line). Panel B: Sedimentation coefficient distributions for preformed apoC-II amyloid fibrils (0.3 mg/mL) before (solid line) and after freeze-thaw treatment (dashed line). Distributions for the untreated sample (dotted line) and freeze-thawed samples (dot-dot-dash line), following incubation at 25° C for 24 h.
