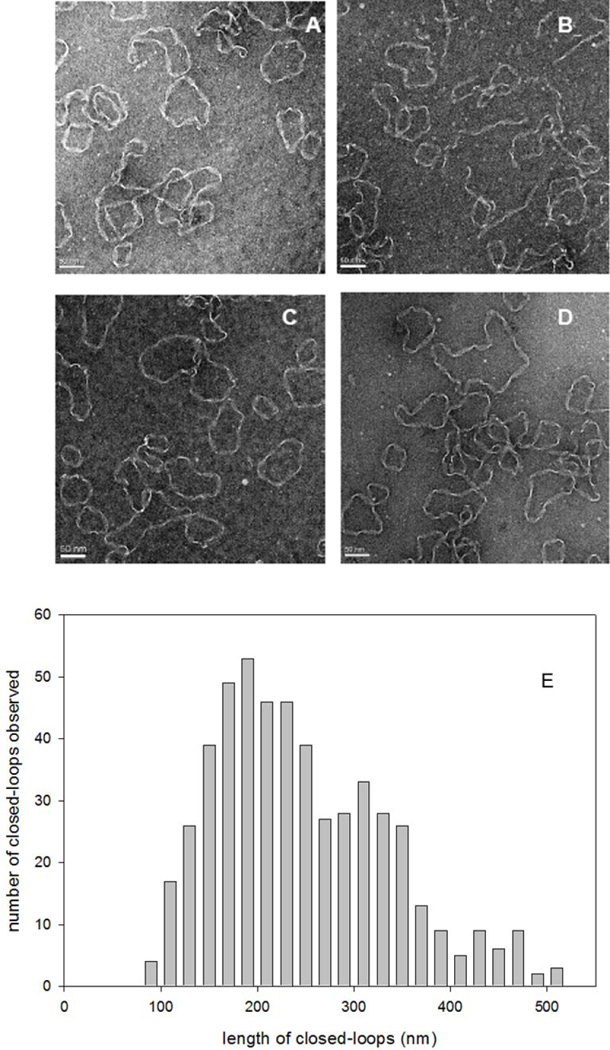
Figure 3.

Electron microscopy of purified apoC-II closed-loops. ApoC-II closed-loops were purified from preformed apoC-II fibrils by preparative ultracentrifugation. Panels A–D: Negative staining transmission electron micrographs showing representative images. Scale bars of 50 nm are shown. Panel E: Distribution of the contour lengths of the closed-loops.
