
Figure 5.
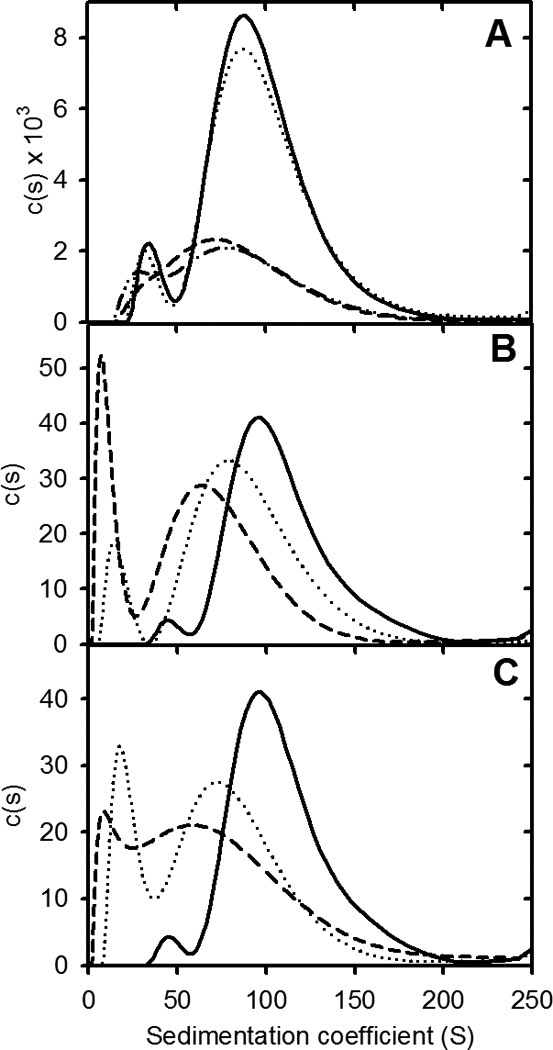
Effect of dilution on apoC-II amyloid fibril size distributions. Panel A: Sedimentation coefficient distributions for preformed apoC-II fibrils (0.3 mg/ml) initially (solid line) and after incubation at 25°C for 7 days (dotted line). Data is also presented for a 1:3 dilution of preformed fibrils, initially (dashed line), and after incubation at 25°C for 7 days (dot-dot-dash line). Sedimentation velocity was monitored at 280 nm. Panels B and C: Sedimentation coefficient distributions for preformed apoC-II fibrils (0.3 ml/ml), incubated with Alexa488-labelled apoC-II and DTT (1 mM) for 4 hrs prior to analysis. Sedimentation velocity was monitored by fluorescence detection. Data is presented for samples diluted 1:10 (Panel B) and 1:100 (panel C), initially (dashed lines) and after incubation at 25°C for 7 days (dot-dot-dash line). The solid lines in panels B and C are scaled distributions obtained for the undiluted sample after incubation for 7 days.