
Figure 7.
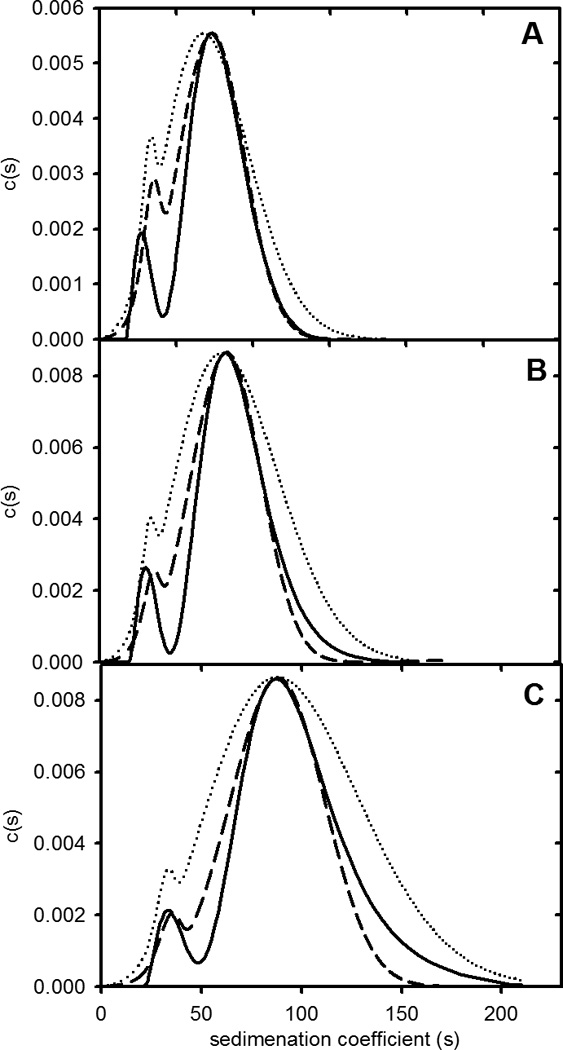
Fit of experimental fibril size distributions with theoretical model. Experiment data for fibrils formed at different apoC-II concentrations (Figure 1B) were fitted to the model presented in Figure 6. Parameters used to fit the data are summarised in Table 3. Panels A-C present experimental size distributions at 0.1 mg/mL, 0.3 mg/mL and 0.5 mg/mL, respectively (solid lines), and the corresponding theoretical fits assuming size independent (dotted lines) or size-dependent isodesmic self-association constants (Dashed lines).