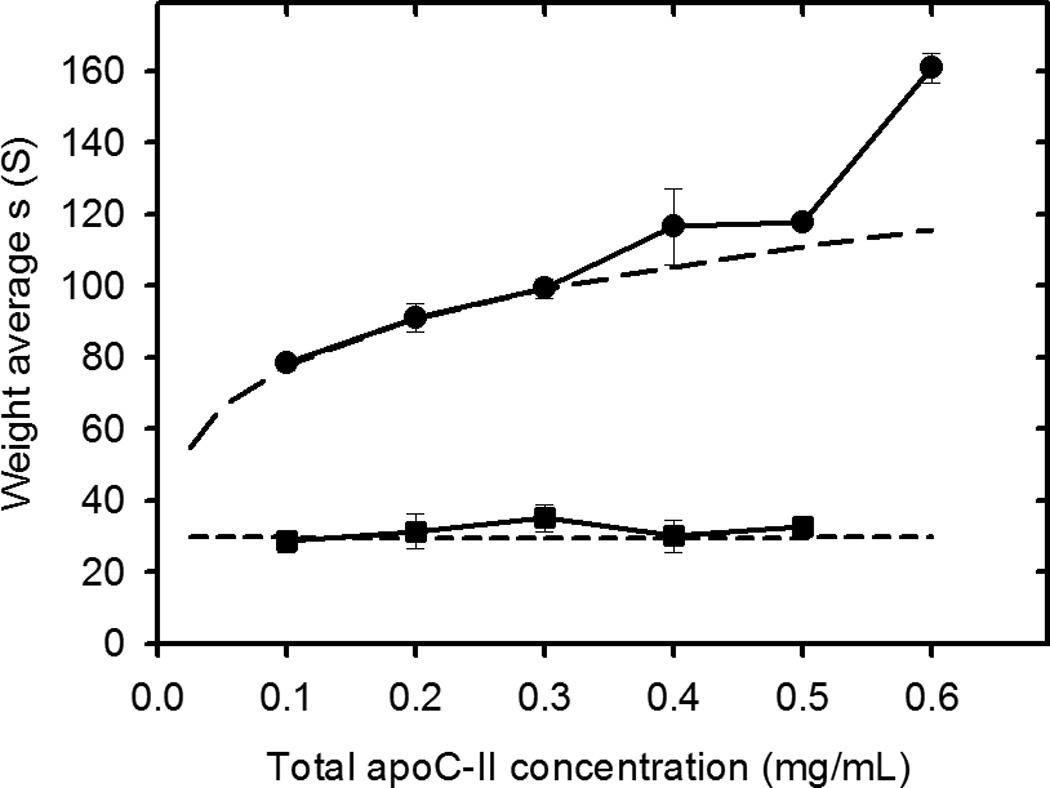
Figure 8.

Fit of model shown in Figure 6 to the dependence of apoC-II fibril size on total apoC-II concentration. Weight-average sedimentation coefficient values for the faster moving and slower moving population of fibrils (Figure 1C) are shown together with theoretical data (long dashed and short dashed lines, respectively) calculated using the fitted parameters shown in Table 3, assuming a constant value for Keq.
