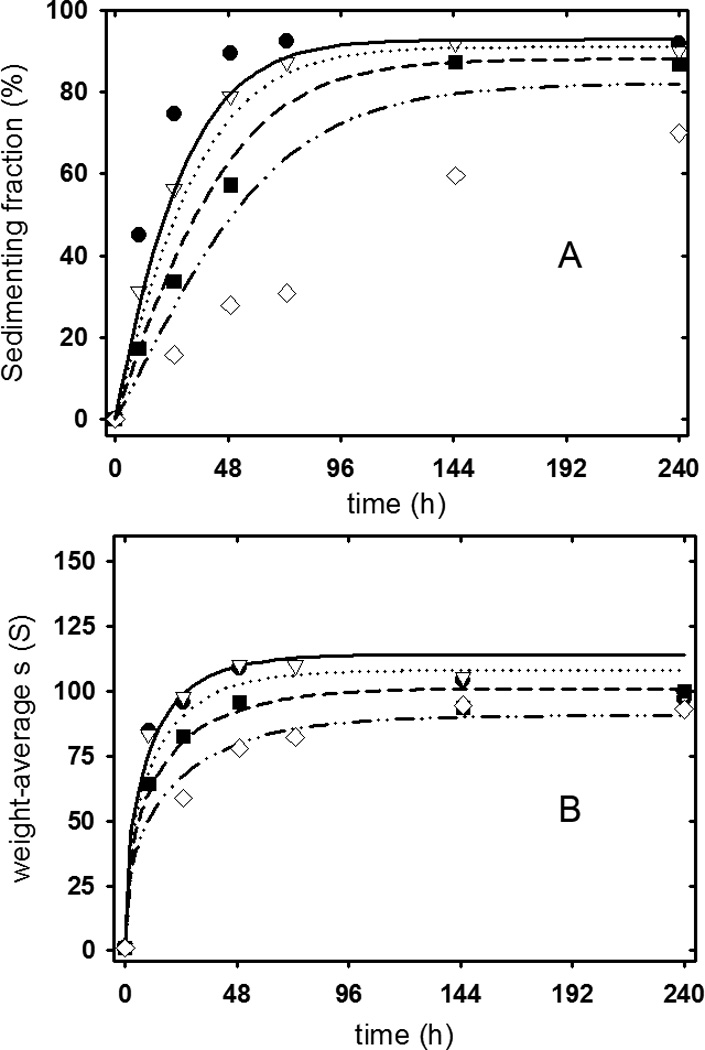
Figure 9.

Application of the equilibrium model to fit the kinetics of apoC-II fibril formation. Data on the rate of fibril formation (Panel A) and on the change in weight-average sedimentation coefficient with time (Panel B) are from17. The experimental data was analysed according to the equilibrium model presented in Figure 6 and the parameters summarized in Table 3, extended to include rate constants for the various equilibria (see Theory section). Experimental data (symbols) and theoretical fits (lines) are shown for fibrils formed at 0.2 mg/mL (diamonds, dash-dot-dot line), 0.3 mg/mL (squares, dashed line), 0.4 mg/mL (triangles, dotted line) and 0.5 mg/mL (circles, solid line).
