
Figure 5. Comparison of skin and oral keratinocyte migration by Gold-Colloidal Migration Assay.
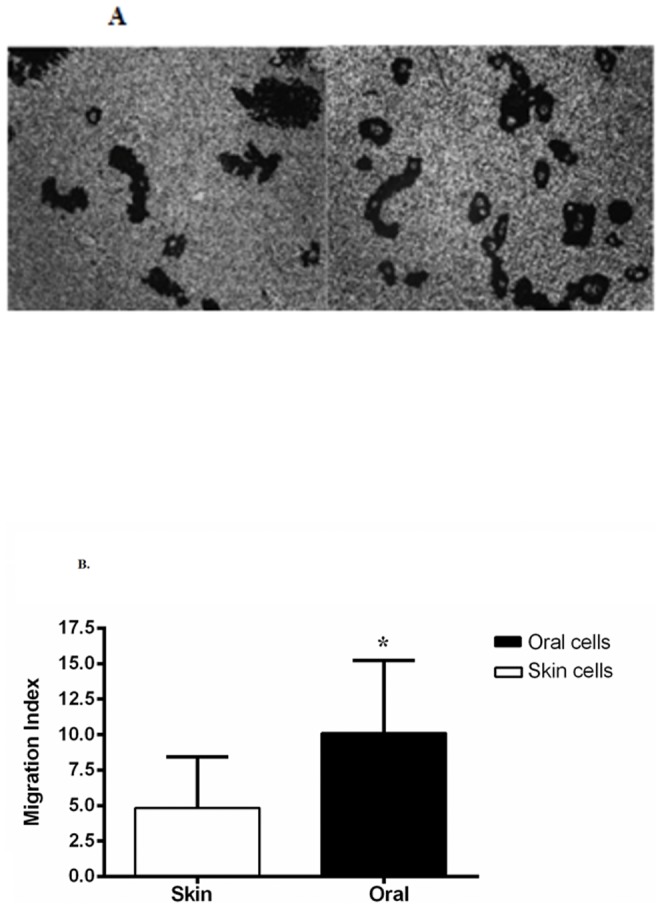
Photographs are representative examples of the tracks made by single cells. The sum of the track areas in the field was divided by the total area of the field and multiplied by 100 to yield the percentage of each field taken up by tracks. This percentage was called the migration index (MI). A) Representative migration assay slides of paired human skin and oral keratinocytes. B) Skin keratinocyte MI 5.1±1.5 and oral keratinocyte MI 13.0±2.7 respectively. Average migration fold ratio of (2.6 fold) oral/skin of N = 3 independent paired oral and skin keratinocyte migration assays.