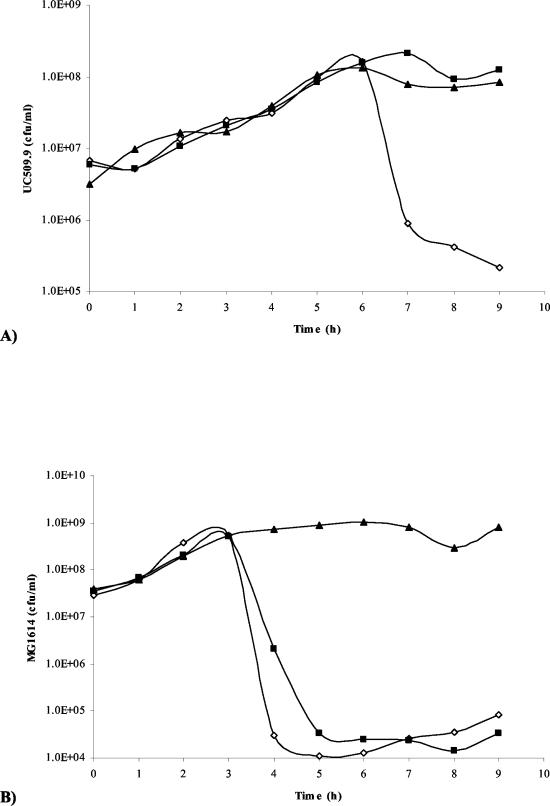
FIG. 5.
(A) Graph of numbers of viable L. lactis UC509.9 cells versus time (hours). This graph is representative of results for a number of MOI values and times of addition of Tuc2009. (B) Graph of numbers of viable L. lactis MG1614 cells versus time (hours) upon infection with c2 phage at an MOI of 0.02. In both cases, cultures without phage, with phage and preimmunization bleed, and with phage and bleeds postimmunization with Tal2009-5ΔN are denoted as closed triangles, open diamonds, and closed boxes, respectively.

