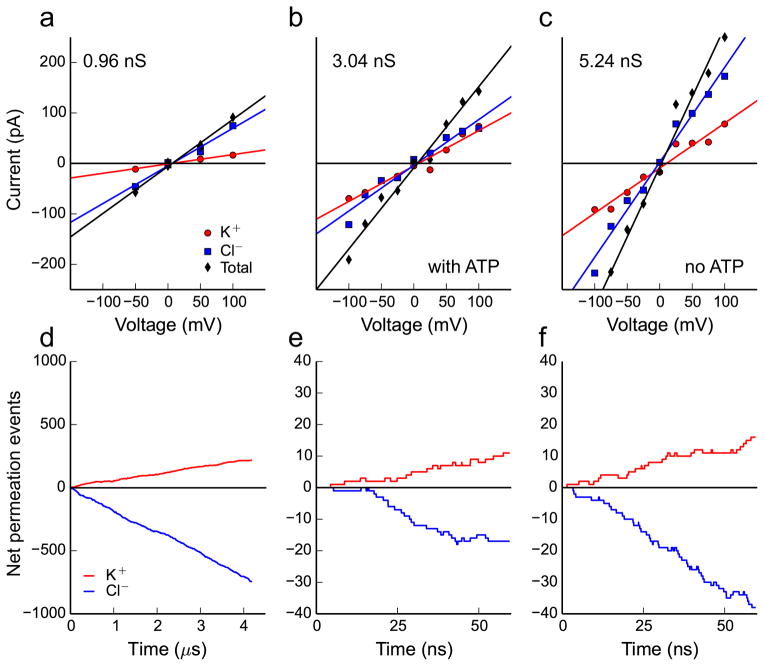
Fig. 2. Simulated current-voltage curves and ion permeation rates for mVDAC1.
a–c, Current-voltage curves under different ionic and ATP conditions. The current carried by K+ is represented by red circles, the Cl− current is represented by blue squares and the total current is their sum represented by black diamonds. The lines are linear regressions of the respective data points, and they represent the current-voltage curves for the total current (black line), Cl− current (blue line) and K+ current (red line). Panel a is compiled from 16.9 μs of aggregate simulation time carried out on a system in 142 mM KCl with ATP in the channel pore. Panels b and c are compiled from shorter 60 ns simulations under high salt (900 mM KCl) with or without ATP in the pore, respectively. d–f, The cumulative net number of channel crossing events by Cl− (blue traces) and K+ (red traces) tracked over the time course of each simulation at +50 mV for physiological salt (142 mM) in d, high salt (900 mM) with ATP in the pore in e, and high salt (1 M) with no ATP in the pore in e.

