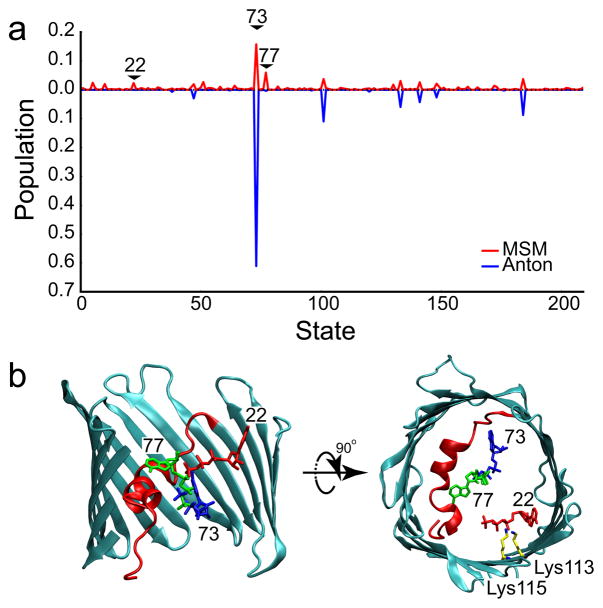
Fig. 3. ATP adopts many conformations in the mVDAC1 pore.
a, Steady state distribution of ATP in the pore domain, defined as −18 Å ≤ z ≤ 20 Å, calculated from the Markov State Model (red). The most stable state (#73) has 16% occupancy. The data from the longest Anton simulation (4.8 μs) was projected onto the MSM states (blue), and the time spent in each state was used to determine the relative probability of occupancy (plotted in the negative direction for clarity). b, The most stable ATP configurations are structurally diverse. The generators for the 1st (#73, blue), 2nd (#77, green), and 9th (#22, red) most populated states are depicted. The phosphate tails of states 73 and 77 interact with basic residues (Lys12, Arg15 and Lys20) on the N-terminal helix, while the phosphate tail of state 22 interacts with Lys113 and Lys115 on the wall of the β-barrel.

