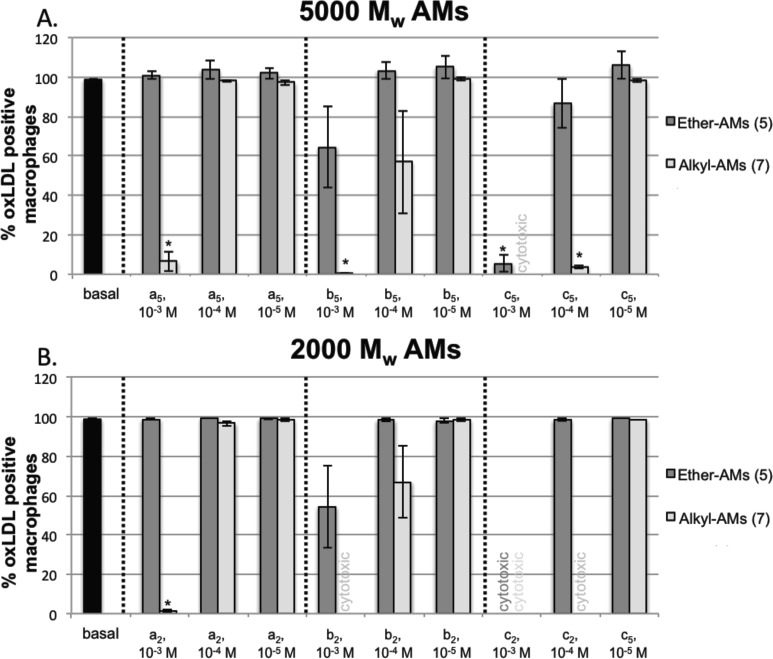
Figure 4.
Percent of HMDMs positive for oxLDL after incubation with varying concentrations of 5000 Mw (A) and 2000 Mw (B) ether-AMs (dark gray) and alkyl-AM analogues (light gray). AMs of specific alkyl lengths are grouped between the dashed lines, and the AM treatments not investigated due to cytotoxicity are indicated as text on the graph. Significant deviations from the oxLDL positive control (black) are denoted by asterisks (∗) on the graph.

