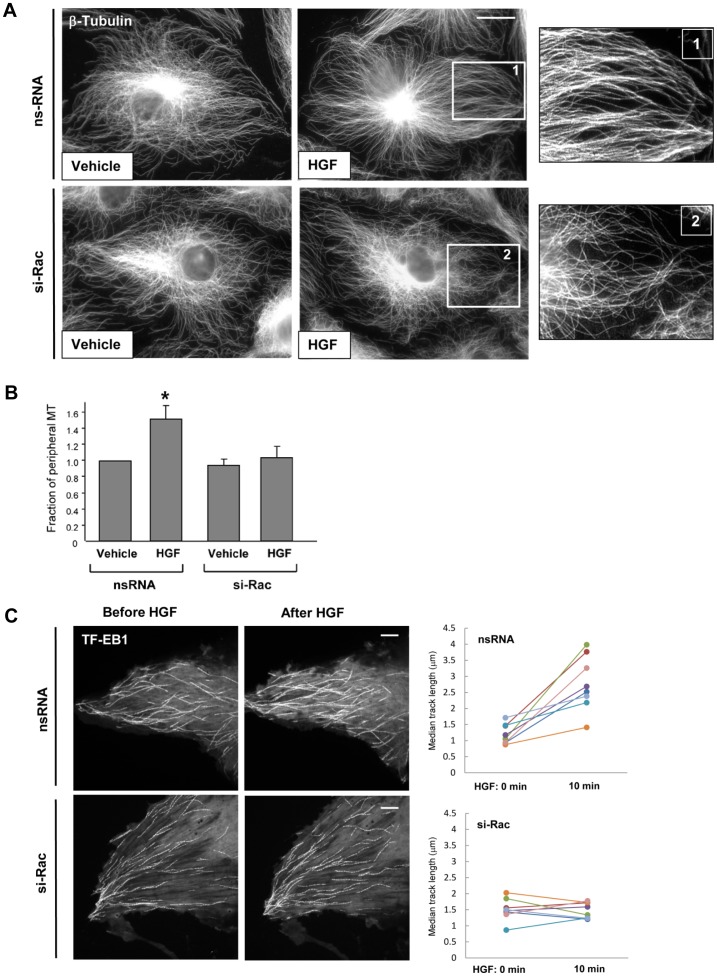
Figure 2. Role of Rac1 in HGF-induced stimulation of peripheral MT network formation.
A: Cells grown on coverslips were transfected with non-specific RNA or Rac1-specific siRNA and stimulated with HGF (50 ng/ml, 10 min) followed by immunofluorescence staining with an antibody against β-tubulin. Bar = 5 µm. Magnified images (insets) show details of MT structure. Results are representative of four independent experiments. B: Fraction of peripheral MT was quantified as described in Methods; *P<0.05; n = 4; 6 images from each experiment. C: Projection analysis of 20 consecutive images in control (top panel) and Rac1 knockdown (bottom panel) live cells before and after HGF treatment shows changes in GFP-EB1 track length. Bar = 2 µm. Quantification of GFP-EB1 track length is presented on right panels. Results are representative of four independent experiments; eight cells have been inspected for each condition, in each experiment.

