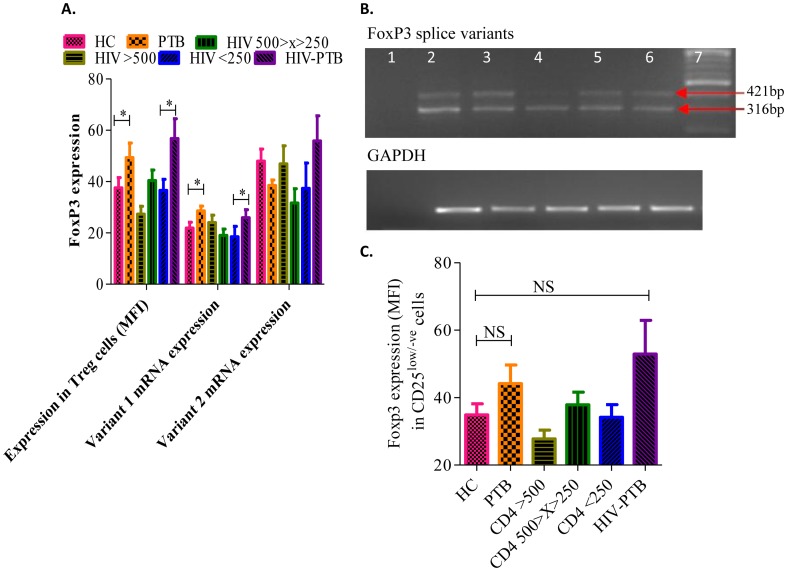
Figure 3. High FoxP3 expression in PTB patients with or without HIV-1 co-infection correlated with FoxP3 variant-1 mRNA expression only.
A. Bar diagram depicting expression of intracellular Foxp3 within CD4+ T-cells, the relative expression of Foxp3 variant-1 and variant 2 mRNA (normalized using GAPDH levels) in all studied groups. Data were expressed as Mean±SEM and p-value < 0.05 (*) was considered significant. B. Representative 2% agarose gel image of RT-PCR products, showing mRNA levels of FoxP3 splice variant 1 (421 bp) & variant 2 (316 bp) and their corresponding housekeeping gene, GAPDH (180 bp) in PBMCs of HIV-1 infected individuals. Lane 1: Negative control, lanes 2-6: HIV-1 infected individuals and lane 7: 100 bp DNA ladder. C. Higher FoxP3 expression in CD25low/-ve cells from PTB patients with or without HIV-1 co-infection. Whisker box plot showing levels of FoxP3 expression (MFI) in CD25low/-ve cells in the PBMCs of study subject groups. The horizontal line within the box indicates the median, the boundaries of the box indicate the 25th- and 75th -percentile, and the whiskers indicate the highest and lowest values of the FoxP3 expression.

