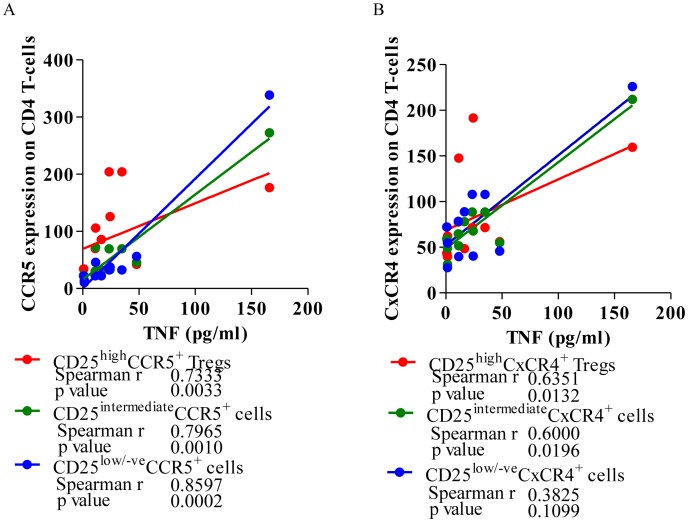
Figure 7. TNF-α level bear a significant correlation with CCR5 and CxCR4 expression on CD4 T-cells.
A. A representative scatter diagram depicting the Spearman correlation between TNF-α (pg/ml), CCR5 expression (MFI) on CD4+CD25high Tregs, CD25intermediate and CD25low/negative effector cell in PBMCs from HIV-1 infected individuals. B. A representative scatter diagram depicting the Spearman correlation between TNF-α (pg/ml), CxCR4 expression (MFI) on CD4+CD25high Tregs, CD25intermediate and CD25low/negative effector cell in PBMCs from HIV-1 infected individuals. The solid line represents linear regression of points. Rho and p-values are from the Spearman rank correlation test.

