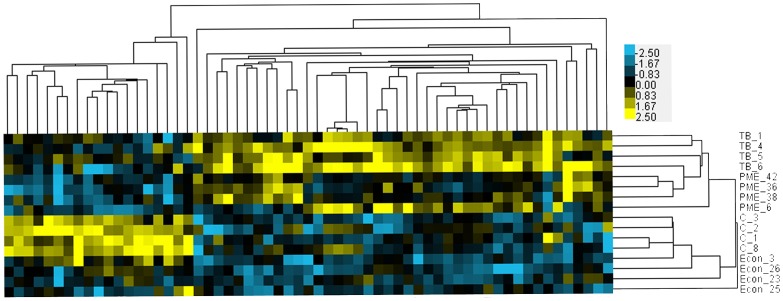
Figure 5. Gene expression profile comparisons between Fenholloway (PME) and reference site (Econ) female G. holbrooki and female G. holbrooki exposed to the androgen 17β-trenbolone (TB) or the vehicle control (C).
This set of genes were differentially expressed between the PME, Econfina, and TB groups over the lab controls with at least a 1.5-fold difference of expression over the lab control and was expressed in the same direction in those groups. Data were median-centered by gene and clustered using spearman correlation and centroid linkage. Yellow genes are more highly expressed than the gene average and blue genes are expressed at a lower level than the gene average.

