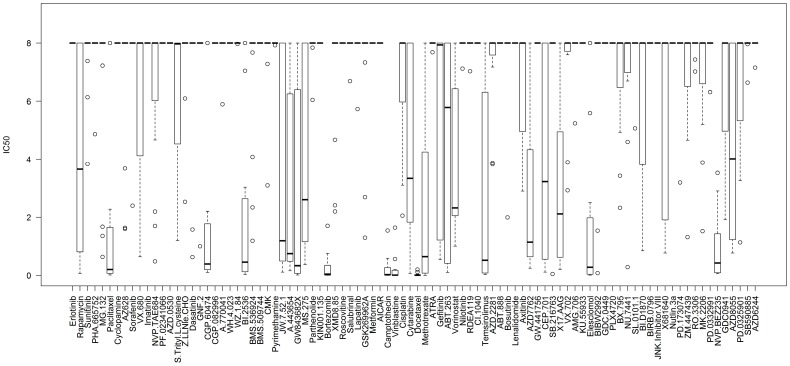
Figure 1. Boxplot of drug sensitivity in SCLC cells using the CGP dataset.
There are 31 cell lines for small cell lung cancer. The boxplots show drugs listed on the x-axis and the corresponding IC50 values (in µM) listed on the y-axis. The ‘ceiling’ for drug efficacy was set at 8 µM; if the IC50 of all tested cells was above this concentration a single line would appear at the top of the graph. This represents an ineffective drug. By contrast, if all tested cells were sensitive to a given drug, a narrow box and whisker plot would appear at the bottom of the graph. The line within individual boxes represents the median IC50 value of all tested cells and the circles represent ‘outlier’ cells whose IC50 values do not fall within the 25–75% quantile of all IC50 values measured for that drug (represented by the box).

