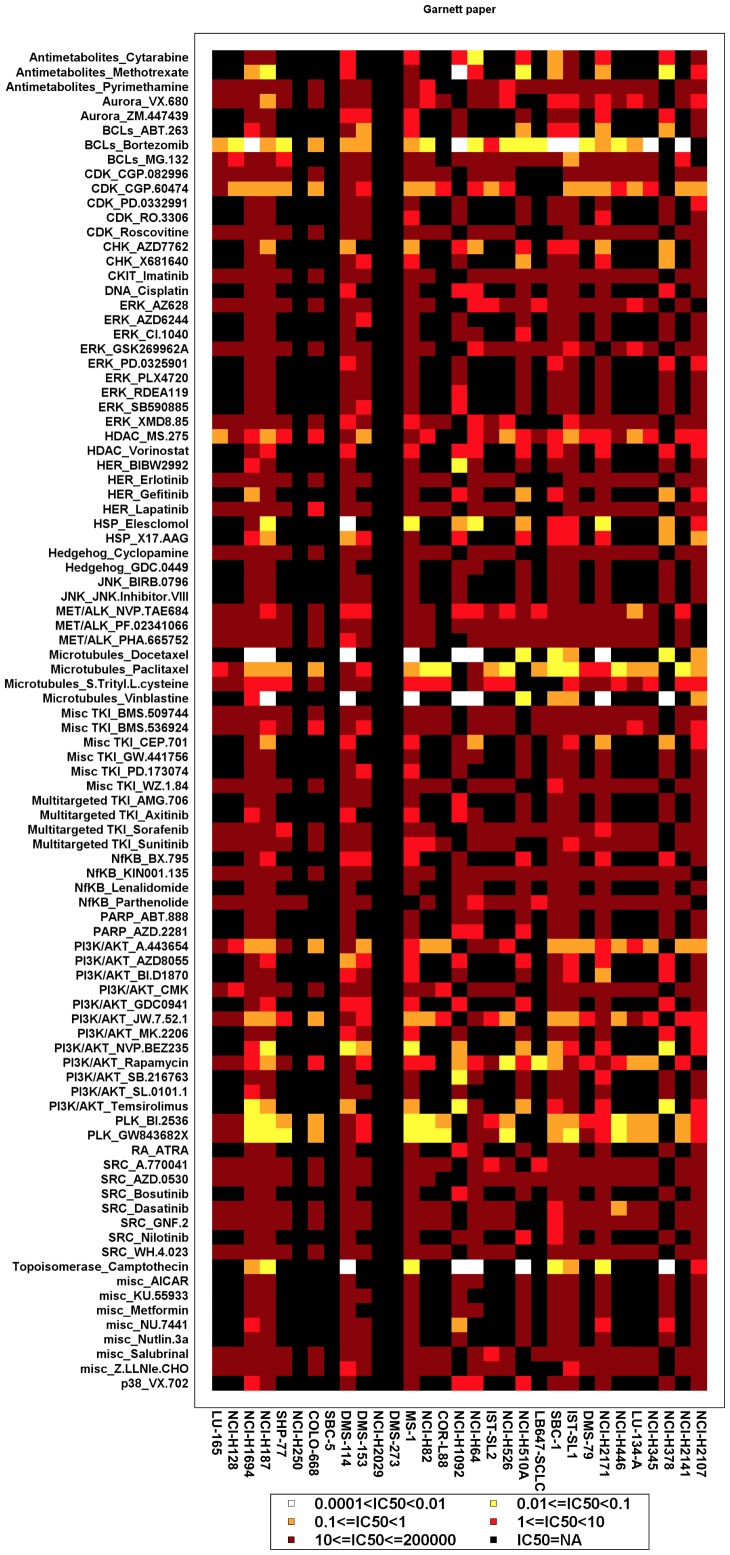
Figure 3. Mosaic plot of drug sensitivity using gene expression clustering of SCLC cells.
Drug sensitivity was color-coded according to the legend at the bottom. Drugs are grouped along the y-axis according to their target molecule. Cells are arranged along the x-axis identical to their gene expression clustering identified in Figure 2.

