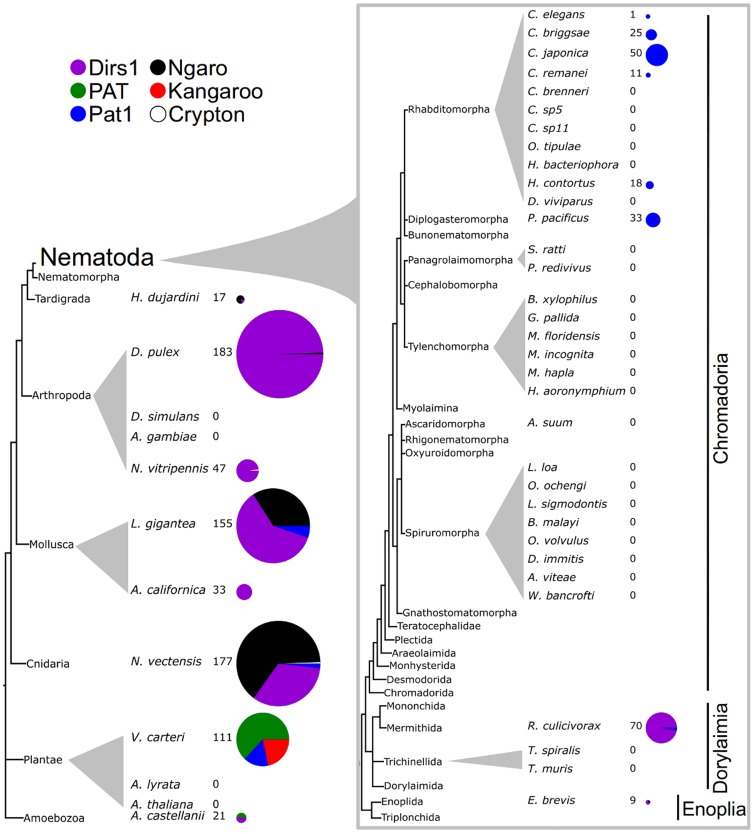
Figure 3. The distribution of YREs among Nematoda and outgroup species.
The phylogenetic tree of Nematoda is based on De Ley and Blaxter [47] and Kiontke et al. [48]. Element types are colour coded. The phylogenetically classified YRE matches in each species are indicated. Pie-charts represent the proportion of each element type with their radii proportional to the number of phylogenetically classified YRE matches.

