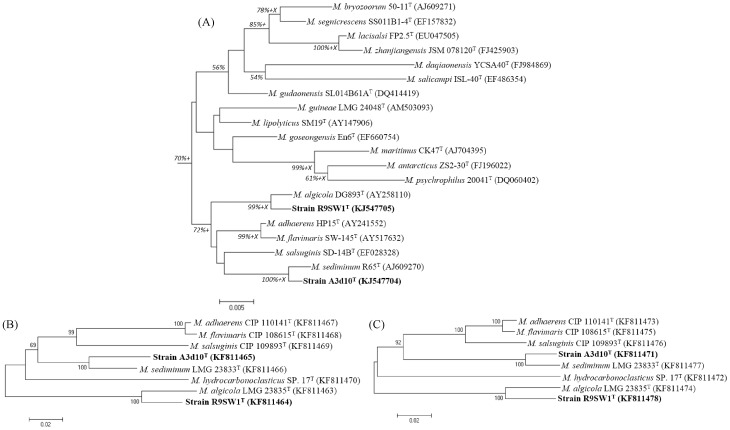
Figure 1. Neighbour-joining phylogenetic tree showing the taxonomic position of strains R9SW1T and A3d10T according to their (A) 16S rRNA, (B) gyrB and (C) rpoD gene sequences.
Numbers at branching points are percentage bootstrap values based on 1000 replications, with only values above 50% are shown. Scale bar represents 0.005/0.02 substitutions per nucleotide position. The Maximum-likelihood (ML) and maximum Parsimony (MP) algorithms were also used for tree construction, where branches in agreement with ML and MP methods were marked with + and X respectively.

