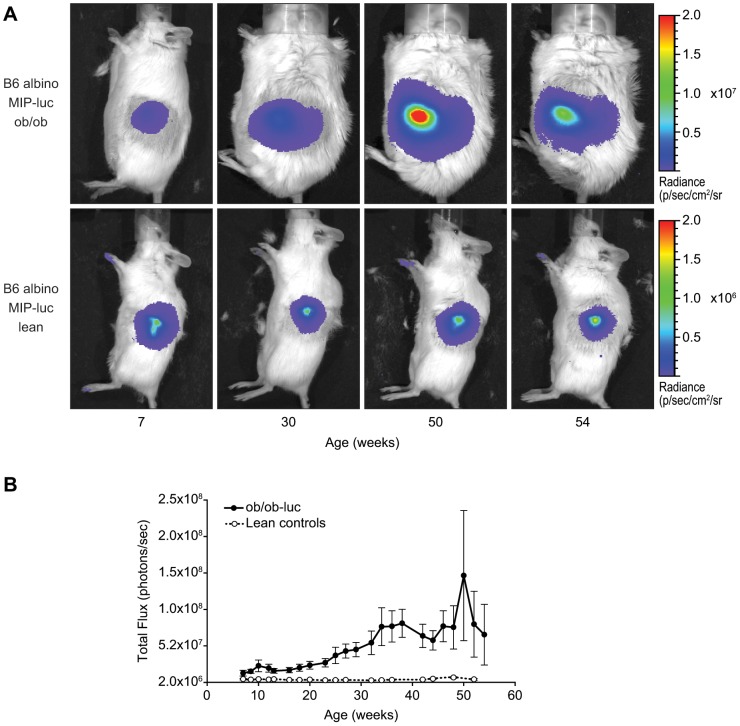
Figure 2. Longitudinal images of B6 albino MIP-luc lean (lean controls) and B6 albino MIP-luc ob/ob (ob/ob-luc) mice.
A) Representative BLI of ob/ob-luc and lean controls over time. In ob/ob-luc mice the area of signal also increases, which could indicate an increase in the number of islets with age. However, the scatter of photons by adipose tissue may also contribute to the size of the detected area. Note: lean control mice are on a separate color scale since ob/ob-luc mice have higher luciferase expression B) Results of ROI analysis was performed on the pancreas signal of both ob/ob-luc (closed symbols) and lean control mice (open symbols) (N = 13 each). The ROI was drawn over the entire signal and presented as total flux (p/s). In ob/ob-luc mice the signal increases with age while in lean controls it remains unchanged.

