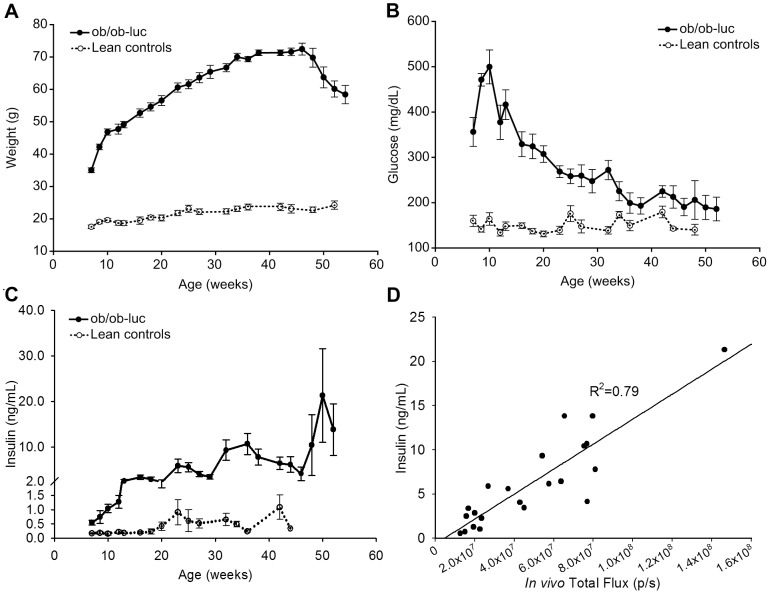
Figure 3. Characterization of ob/ob-luc mice.
A) Weight increases significantly with age in ob/ob-luc mice consistent with the original ob/ob mouse model on the B6 black background. As early as week 8 the ob/ob-luc mice are 2.5 times the weight of their lean control counterparts. Blood was taken from fasting mice following imaging to measure B) glucose and C) insulin. Glucose levels in ob/ob-luc mice (closed symbols) are significantly higher than lean controls (open symbols) at week 8 (p<0.001, t-test). As the ob/ob-luc mice age the glucose levels decrease and reach similar levels as lean controls by week 45. Insulin levels in ob/ob-luc mice increase with age while insulin levels in lean mice remain stable with age. Both glucose and insulin levels follow similar trends as normal ob/ob mice, indicating that the additional genetic manipulation (albino and MIP-luc) did not affect the physical characteristics of the ob/ob model. D) There is a good correlation (R2 = 0.79) between plasma insulin levels and in vivo BLI measurements.

