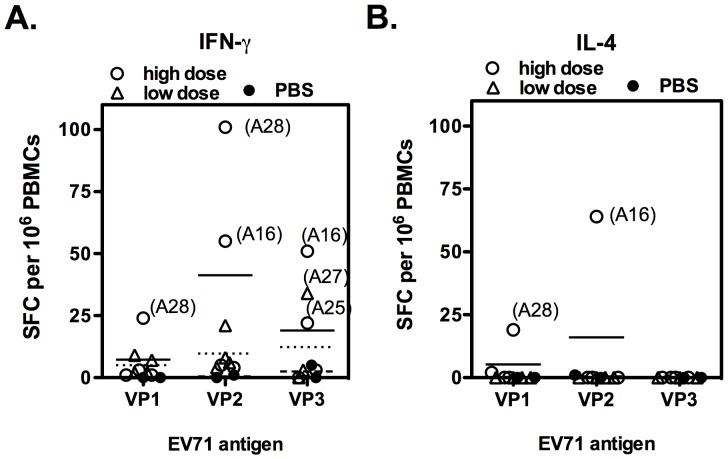
Figure 2. Analysis of dominant T-cell region among EV71 capsid proteins.
PBMCs from monkeys that had received a 2nd immunization (week 6) were stimulated with recombinant VP1, VP2 or VP3 protein, and the T-cell response was analyzed by ELISPOT. The IFN-γ (A) and IL-4 (B) response from individual monkeys are represented (blank circle: high dose; blank triangle: low dose; black circle: PBS control), and the mean for high and low dose and PBS control are also indicated by a straight line, dotted line and dashed line, respectively.

