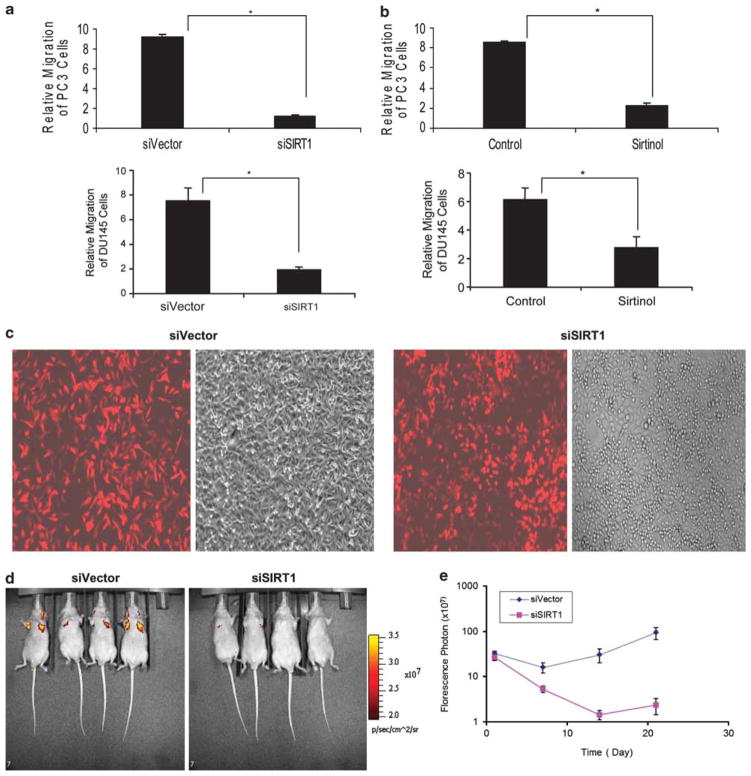
Figure 6.
SIRT1 silencing by siRNA or pharmacological inhibition reduces cell migration in vitro and reduces PC3 metastasis in vivo. 1 × 10⁵ of SIRT1 siRNA (siSIRT1) and control siRNA (siVector) DU145 and PC3 cells (a) or SIRT1 inhibitor Sirtinol (25 μM) treated DU145 and PC3 (b) cells were loaded into chamber inserts containing an 8-μm pore size membrane coated with Collagen I. The migrated cells were stained after 24 h incubation at 37 °C and the migrated cells were calculated based on the cell density read at 560 nm. Each experiment was performed in triplicate and repeated a minimum of three times. The error bars represent the s.e.m. Asterisks indicate significant differences between two groups (*P < 0.01). (c) Representative fluorescent and light microscopic images show the expression efficiency of TomatoRed in SIRT1 siRNA and control siRNA PC3 cells. The TomatoRed-tagged PC3 SIRT1 knockdown (PC3siSIRT1) or PC3 vector control cells (PC3siVector) cells were established by infection with the pHAGE2 lentivirus that is produced by co-transfection of 293T packaging cell line with the TomatoRed vector EF1a-m-tomato-w and lentivirus helper plasmids including VSV-G, gag/pol, Rev, and Tat (Vector Core - Center for Regenerative Medicine Boston University). (d) Representative fluorescent imaging of nude mice injected with PC3 cells stably expressing control siRNA and SIRT1 siRNA on day 21 after inoculation. The fluorescence imaging data is displayed as the photon flux (p/s). (e) Quantification of fluorescence imaging data acquired at day 1, 7, 14 and 21. The data is displayed as the photon flux (p/s) and was presented as the mean ± s.e.m. (n = 4).

