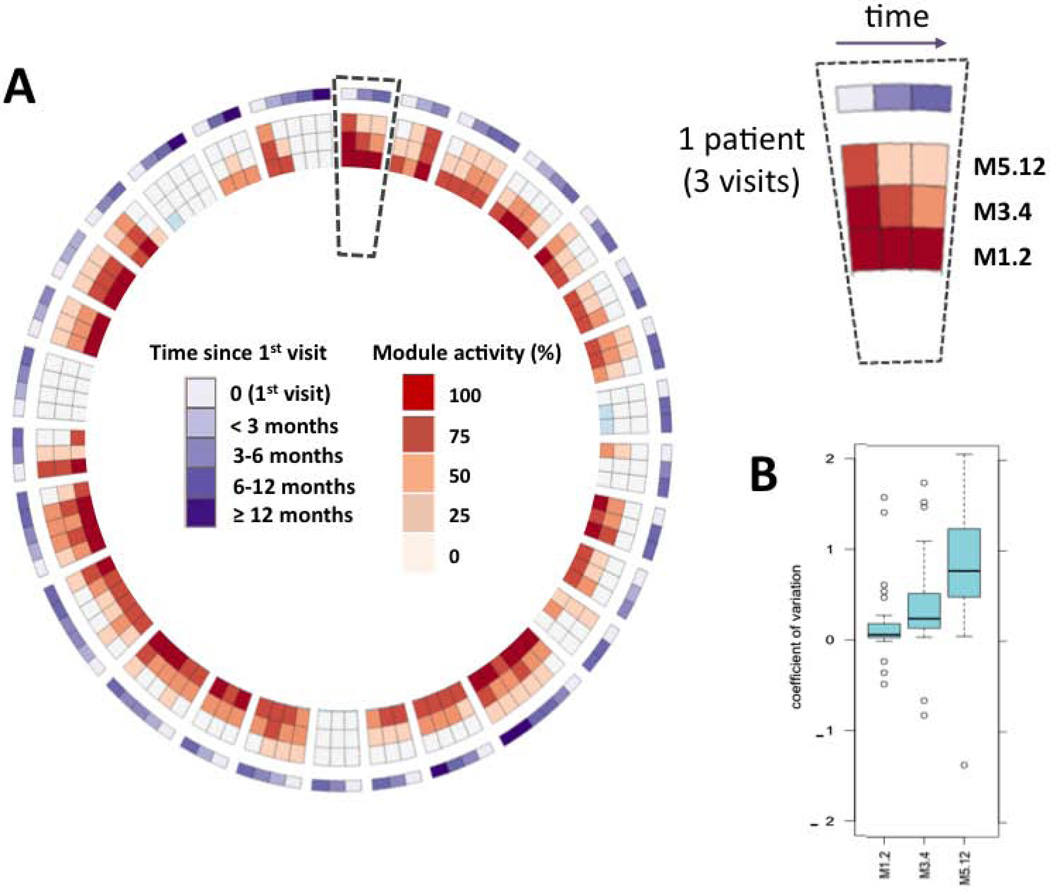
Figure 3. Longitudinal intra-individual variation of IFN modules in SLE patients.
Longitudinal analyses were obtained for 29 SLE patients with at least 3 consecutive visits. A: The level of upregulation of each IFN module at each visit is plotted on the circos figure, representing from center to periphery M1.2, M3.4, M5.12 and time elapsed since 1st visit. Spaces separate different patients (e.g., 3 visits of the same patient are framed by the dotted line). B: Coefficient of variation (mean CV ± SD), corresponding to intra-individual variability of IFN modules, indicates that while M1.2 is stable over time for a given patient (CV = 0.05 ± 0.88), M3.4 (CV = 0.39 ± 0.56) and even more M5.12 (CV = 0.91 ± 0.82) show fluctuations across time, reflecting the complexity of IFN signature. These differences of variability between modules are significant (M1.2 CV vs. M3.4 CV, p= 0.0033; M1.2 CV vs. M5.12 CV, p = <0.0001; M3.4 CV vs. M5.12 CV, p = 0.00065).

