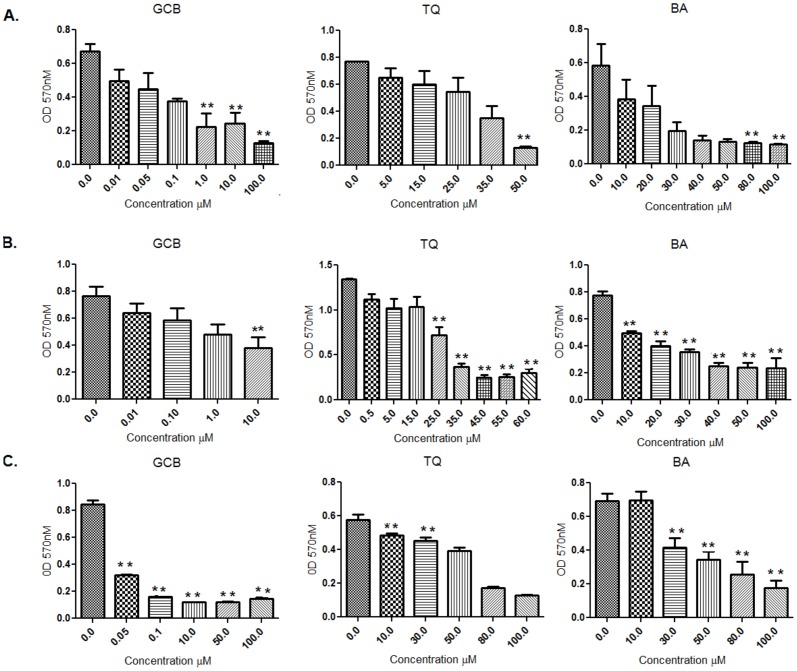
Figure 1. IC50 of Gemcitabine, Thymoquinone and Betulinic acid at 48 hrs.
IC50 value was calculated on Human pancreas adenocarcinoma cell lines (A) MIA PaCa-2 (B) PANC-1 and (C) Normal cell line FR2: For individual treatment of Gemcitabine, Thymoquinone and Betulinic acid for 48 hrs (**, significant as compaired to control at p value<0.01, n = 3) in-between the three cell lines.

