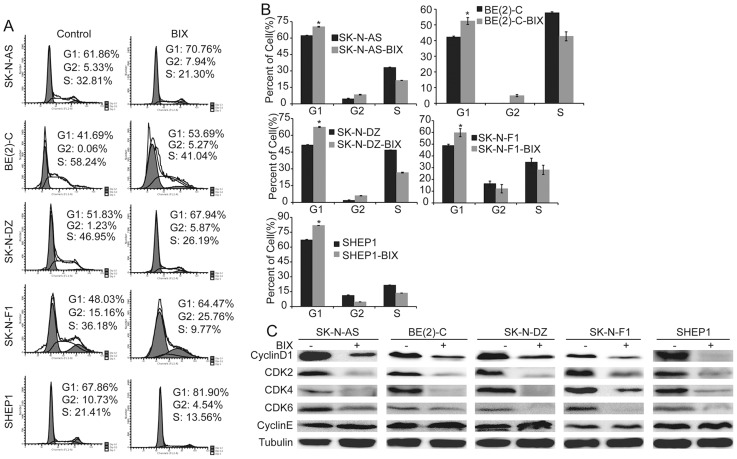
Figure 3. Inhibition of G9a induces cell cycle arrest in G1 phase.
A and B, neuroblastoma cells were either treated with 5 µM BIX01294 or water for 2 days and analyzed for the cell cycle by flow cytometry. Each column represents the average obtained from three independent experiments; error bars, SD. Statistical analysis was performed using two-tailed student's t-test, *p≤0.01. C, western blot analysis of cyclins and CDKs associated with G1 phase in neuroblastoma cells treated with BIX01294 or water for 2 days. α-Tubulin levels are shown as the loading control.

