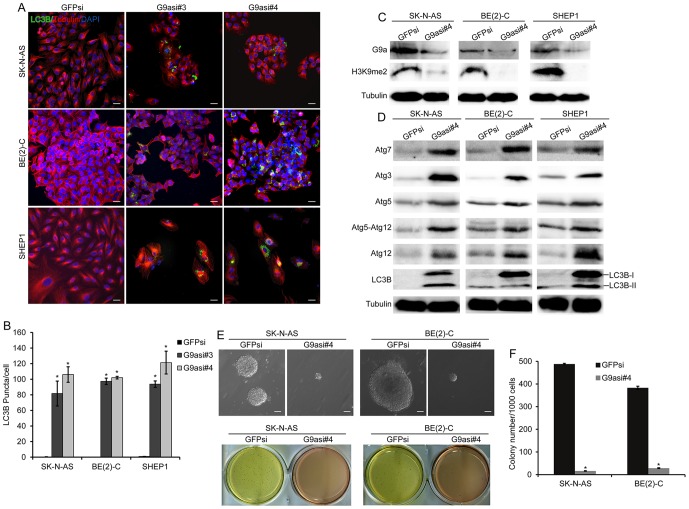
Figure 7. Downregulation of G9a induces autophagy and decreases tumorigenicity in neuroblastoma cells.
A, immunofluorescence analysis of three neuroblastoma cells expressing GFPsi, G9asi#3 or G9asi#4. Scale bar, 5 µm. B, statistical analysis of LC3B puncta in neuroblastoma cells expressing GFPsi, G9asi#3 or G9asi#4. Each column represents the average obtained from three independent experiments; error bars, SD. Statistical analysis was performed using two-tailed student's t-test, *p≤0.01. C and D, western blot analysis of G9a function (C) and autophagy-related genes (D) in neuroblastoma cells expressing GFPsi or G9asi#4. α-Tubulin levels are shown as the loading control. Cells expressing GFPsi are shown as the biological control. E, neuroblastoma cells were plated at 1×10³ cells per well in six-well culture plates. After 14 to 21 days of culture, soft agar colonies developed with cells expressing GFPsi. As shown, the cells with G9a knockdown were observed to give rise to small and scanty colonies in soft agar, Scale bars, 50 µm. F, Colonies that were larger than 0.5 mm or that contained more than 50 cells were recorded. Each column represents the average obtained from three independent experiments; error bars, SD. Statistical analysis was performed using two-tailed student's t-test, *p≤0.01.

